

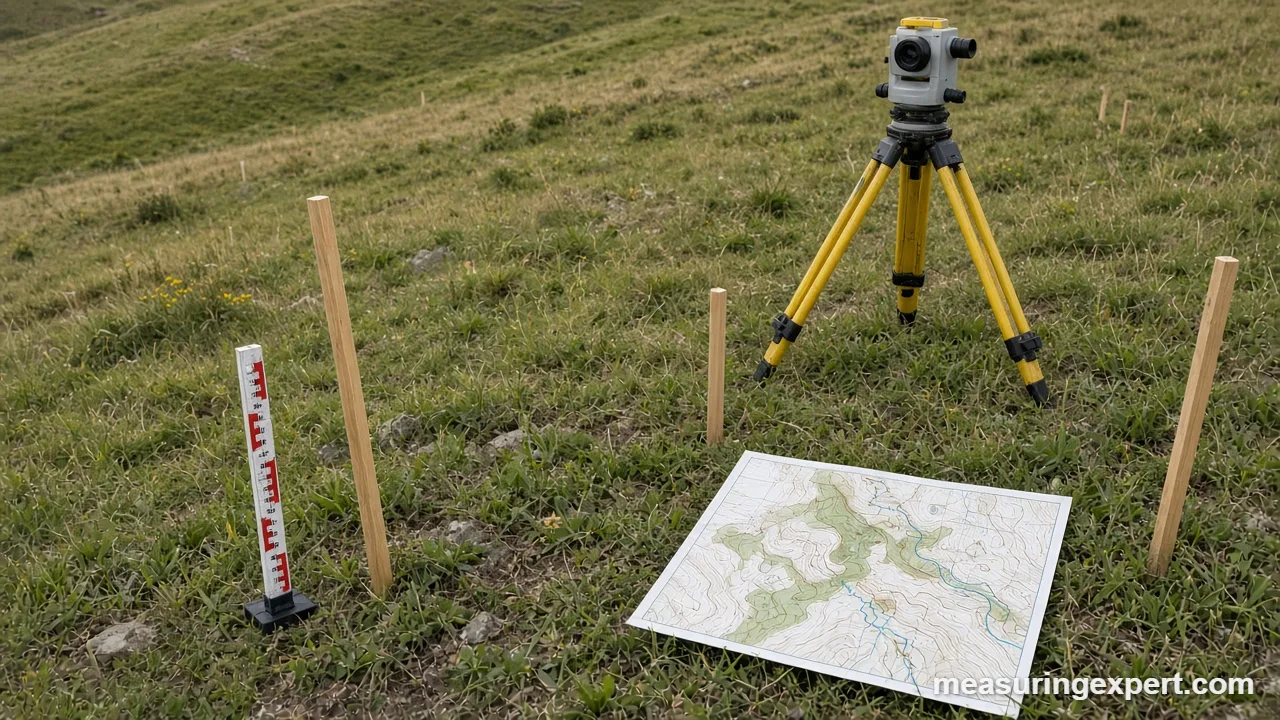
Contour lines are lines on a map that join points of equal elevation. To measure them, set a benchmark, take level or GPS readings on a grid, and interpolate where whole-number elevations fall between your points. Then connect equal values, keep the interval constant, and check the result against the ground.
Therefore, maps with these lines turn a flat drawing into a picture of hills, slopes and valleys. For instance, developers use them to decide where roads, pads and drainage can go. A steep site costs more to grade, whereas a gentle one may flood. As a result, a good topographic map often saves more money than any other early survey.
The process has three parts. First, you collect elevations at known positions. Next, you work out where each whole-number elevation crosses the lines between those points. Finally, you draw and label the lines at a fixed spacing called the contour interval. The steps below cover each part, plus a calculator that turns line spacing into a slope.
In short: closer lines mean a steeper slope, and wider lines mean flatter ground. The US Geological Survey (USGS) draws every fifth line thicker and labels it, so a map becomes much faster to read. You can see the rules in its US Topo elevation specifications.
- What contour lines show
- Slope calculator for contour lines
- Recommended tools for measuring contour lines
- Choosing an interval for contour lines
- How to measure contour lines in the field
- Interpolating contour lines from spot elevations
- Methods for measuring contour lines compared
- Mapping contour lines by hand or software
- Reading contour lines and landforms
- Using contour lines in land development
- Do and don’t
- Honest limits of contour lines
- When to call a surveyor
- FAQs
What Contour Lines Show on a Map
In fact, every point on one contour line has the same elevation above a reference level, usually mean sea level. For example, walk along a line and you neither climb nor descend. However, walk across lines and you change elevation by one interval each time.
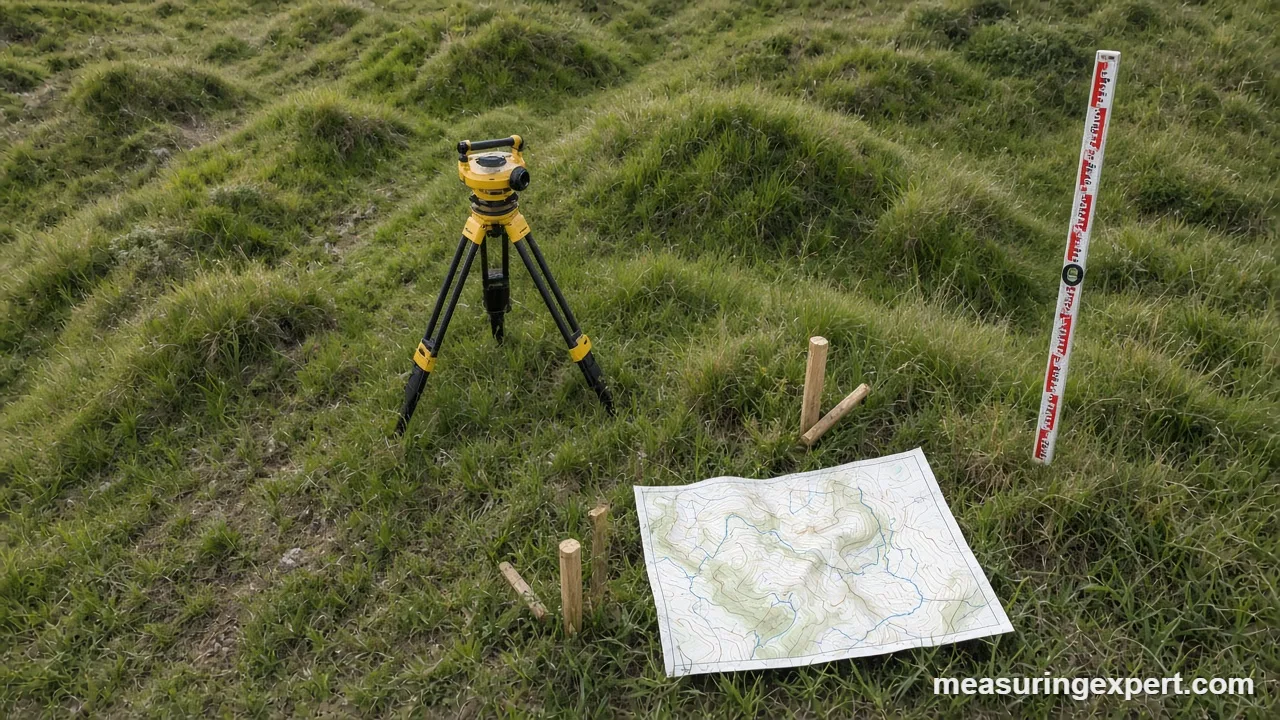
Several rules follow from that definition. First, lines never cross or merge, except at a true overhang or vertical cliff. In addition, lines close on themselves, either on the map or beyond its edge. Also, they bend into a V where they cross a stream, and the V points uphill.
Meanwhile, the vertical distance between neighboring lines is the contour interval. In contrast, the horizontal distance between them changes with the slope. For example, a 2 ft interval with lines 20 ft apart on the ground means the land rises 2 ft over 20 ft, which is a 10% grade.
Slope Calculator for Contour Lines
Enter the grade you worked out from the contour interval and the ground distance between two lines. Then convert the grade to degrees or a roof-style pitch. For instance, 10% grade is about 5.71 degrees.
To use it, first divide the interval by the ground distance between two lines and multiply by 100. A 40 ft interval with lines 0.25 in apart on a 1:24,000 map works out as follows. One inch on that map is 2,000 ft, so 0.25 in is 500 ft. Therefore the slope is 40 / 500 = 8%, or about 4.57 degrees.
Recommended Tools for Measuring Contour Lines
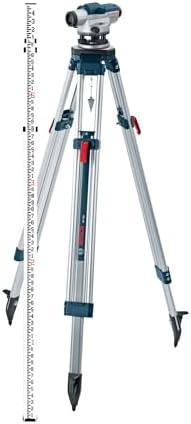
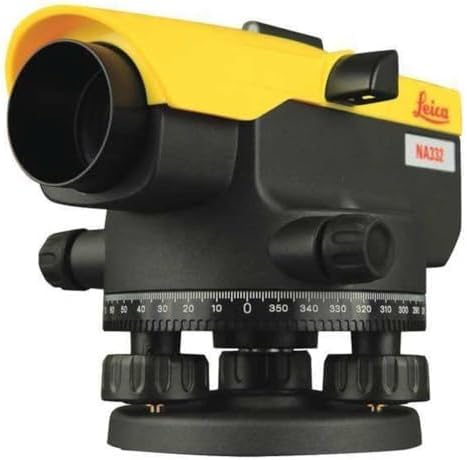
Elevation work needs a way to find height differences and a way to measure distance. For example, an automatic optical level on a tripod handles most small sites, and a rotary laser with a receiver speeds up grid work. In addition, a long fiberglass tape or a measuring wheel sets out the grid. Also check the manufacturer’s stated accuracy before you buy, and ask whether the tool suits your site size.



As an Amazon Associate, Measuring Expert earns from qualifying purchases.
Key Takeaways on Contour Lines
- Contour lines join points of equal elevation, and lines never cross.
- Close lines mean steep ground; wide spacing means a gentle slope.
- Slope in percent equals the interval divided by the ground distance, times 100.
- Pick the interval for the site: small for flat land, larger for steep terrain.
- Every fifth line is usually an index contour, drawn thicker and labeled.
- Interpolation assumes the ground slopes evenly between two measured points.
- Final design and permit drawings need a licensed surveyor.
How to Choose an Interval for Contour Lines
The interval controls how much detail the map shows. For example, a small interval captures subtle drainage swales but fills the page with lines. However, a large one stays readable but hides small mounds and dips. Typical choices therefore follow the terrain and the map scale.
| Terrain or map | Typical interval | Why |
|---|---|---|
| Flat building lot or parking area | 0.5 to 1 ft (0.15 to 0.3 m) | Drainage depends on small changes |
| Rolling residential site | 2 ft (0.6 m) | Good balance of detail and clarity |
| Steep or large rural site | 5 to 10 ft (1.5 to 3 m) | Keeps lines from crowding together |
| US 7.5-minute topographic quad (1:24,000) | Often 10, 20 or 40 ft | Set by the relief of the area |
Keep one interval across the whole sheet. Otherwise, readers cannot compare slopes from one part of the map to another. Instead, if a small feature matters, add a supplemental line between two regular lines, as the USGS does, and label it clearly.
How to Measure Contour Lines in the Field
Here, the method uses an automatic level and a leveling rod on a square grid. Therefore it suits lots up to a few acres. First, note that you need a benchmark with a known elevation, either from a local survey monument or an assumed value such as 100.00 ft.
- Walk the site and plan the grid. First, mark the boundary and any fences, trees, ditches and buildings. For example, a 25 ft grid suits a small lot; use 50 to 100 ft for larger land.
- Stake the grid corners. Next, run a tape along a baseline, then set perpendicular lines with a right-angle method. Also label each stake with its row and column.
- Set up the level. Place the tripod where it can see many stakes, and level the instrument. Next, read the rod on the benchmark. This backsight gives you the height of instrument (HI).
- Calculate the height of instrument. In short, HI equals benchmark elevation plus backsight. For example, 100.00 + 4.52 = 104.52 ft.
- Read the rod at every stake. Then elevation equals HI minus the rod reading. A reading of 6.12 ft gives 104.52 – 6.12 = 98.40 ft.
- Record and close the loop. First, write each reading down at once. Finally, return to the benchmark and read it again; the two readings should agree within your tolerance.
- Add break points. Finally, shoot the top and bottom of banks, ditch lines and edges of pavement, because the lines bend sharply there.
Interpolating Contour Lines From Spot Elevations
Your grid gives elevations only at the stakes. However, the map needs the points where whole-number elevations fall between them. In other words, linear interpolation assumes the ground slopes evenly between two stakes.
For example, take two stakes 28 ft apart. For example, point A reads 100.4 ft and point B reads 103.2 ft, so the rise is 2.8 ft. The 101 ft contour sits (101 – 100.4) / 2.8 of the way along, which is 6.0 ft from A. In the same way, the 102 ft line sits 16.0 ft from A, and the 103 ft line sits 26.0 ft from A.
| Contour to place | Calculation | Distance from A |
|---|---|---|
| 101 ft | (101 – 100.4) / 2.8 x 28 ft | 6.0 ft |
| 102 ft | (102 – 100.4) / 2.8 x 28 ft | 16.0 ft |
| 103 ft | (103 – 100.4) / 2.8 x 28 ft | 26.0 ft |
Next, repeat this for each pair of neighboring stakes. Then join the marks of equal value with smooth curves. Because the ground is never perfectly even, the break points you shot earlier also help you bend the lines in the right places. For the underlying level and GPS methods, see our guide to measuring land elevation changes.
Methods for Measuring Contour Lines Compared
No single method wins everywhere. Instead, the right one depends on site size, vegetation, budget and the accuracy you need.
| Method | Best for | Main strength | Main weakness |
|---|---|---|---|
| Level and rod grid | Small lots | Low cost, very good vertical accuracy | Slow on large or wooded land |
| Total station | Construction sites | Fast, records distance and angle together | Needs clear line of sight |
| GNSS rover (RTK) | Open ground, large areas | No line of sight needed | Weak under tree cover |
| Drone photogrammetry | Big open sites | Covers acres in one flight | Sees treetops, not bare ground |
| Lidar | Forests and large areas | Can model bare ground | Higher cost and heavy data |
If you plan to use a total station, our walkthrough on how to use a total station for construction layout shows the setup in detail.
Mapping Elevation by Hand or With Software
Once your interpolated marks are ready, you have two choices. You can draw by hand on plan paper, or you can let software build a surface from the points. Each approach has a place, so choose by site size.
Drawing the lines by hand
First, plot the grid at scale and mark each interpolated point with a small tick. Next, sketch light pencil curves through ticks of equal value, and step back to check that they look like real terrain. Finally, ink the lines, thicken every fifth one, and label the index contours with their elevation.
Generating the lines with software
CAD and GIS programs build a triangulated surface from your points and then draw lines at the interval you set. This is quick, but the software only knows the points you gave it. As a result, a missing break line can turn a crisp ditch into a smooth, wrong slope. So always compare the output with your field notes.
Reading Contour Lines and Common Landforms
Once the lines are on paper, their shapes describe the terrain. Below, the table lists the patterns you will see most often.
| Pattern of contour lines | What it means |
|---|---|
| Closely spaced lines | Steep slope or bank |
| Widely spaced lines | Gentle slope or flat ground |
| Closed rings, higher elevation inside | Hill or knoll |
| Closed rings with small tick marks pointing inward | Depression or sink |
| V shapes pointing uphill | Stream valley or drainage swale |
| U shapes pointing downhill | Ridge or spur |
| Lines that merge into one | Vertical cliff or retaining wall |
Water runs at right angles to contour lines, from higher to lower values. As a result, that fact helps you spot where runoff will collect and where a swale should go.
Using Contour Lines in Land Development
Developers read these maps for four jobs. First, they find buildable areas, because many codes limit slopes for foundations, driveways and septic fields. Second, they plan drainage so that water leaves the building area. Third, they estimate earthwork by comparing existing lines with proposed ones. Fourth, they check setbacks and heights against the grade.
Earthwork is where the numbers get large. For example, comparing two sets of lines gives the volume to cut and fill, which our guide to calculating cut and fill volumes explains. In addition, local rules often define building height from the grade, so see how building height is measured before you finalize a design.
Do and Don’t When Drawing Contour Lines
Do
- Use one interval across the whole map.
- Shoot break points at banks, ditches and pavement edges.
- Close the leveling loop on the benchmark.
- Label every fifth line with its elevation.
- Compare the finished map with the real site.
Don’t
- Let two contour lines cross.
- Mix datums from different sources.
- Trust software output without checking the points.
- Draw lines through areas you did not measure.
- Use a wide grid on a bumpy site.
Honest Limits of Contour Lines
In short, contour lines are a model, not the ground itself. They are smooth by design, so features smaller than the interval or the grid can vanish. For example, a 1 ft boulder or a narrow gully may fall between two stakes and never appear.
Moreover, accuracy has a standard behind it. Under the long-standing US National Map Accuracy Standards, 90% of tested points on a published map must be within half a contour interval vertically. In other words, a 10 ft interval allows errors up to 5 ft. Therefore, a map with a large interval cannot support fine grading decisions.
When to Call a Licensed Surveyor
A homeowner can map a small lot for planning, for example. However, permits, stormwater designs, flood-zone work and boundary-sensitive projects need a licensed land surveyor. Also, they hold the equipment, carry insurance and can sign and seal the drawing.
Ask a surveyor to produce the topographic survey when a project is near a property line or a stream. Likewise, hire one if the plan involves large grading or a new septic system. Afterward, a qualified civil engineer uses those lines to design drainage.
For related work on boundaries, see how to measure property boundaries accurately.
Frequently Asked Questions About Contour Lines
How do you measure contour lines?
First, you measure elevations at known points with a level, total station or GNSS rover. Then you interpolate where whole-number elevations fall between the points and connect equal values.
What are three rules for drawing contour lines?
First, lines never cross, every line closes on itself, and the interval stays constant. In addition, lines bend into a V that points uphill where they cross a stream.
How do you calculate slope from contour lines?
Divide the contour interval by the ground distance between two lines, then multiply by 100 for percent. For example, 2 ft over 20 ft is a 10% grade.
What is a contour interval?
It is the vertical distance in elevation between two neighboring lines. For example, common choices are 1 ft on flat sites, 2 ft on rolling land and 10 to 40 ft on topographic quads.
What is an index contour?
An index contour is every fifth line, drawn thicker and labeled with its elevation. As a result, you can count intervals quickly.
What does close line spacing mean?
Close spacing means the ground is steep, because elevation changes quickly over a short distance. Wide spacing means a gentle slope.
Can two lines cross each other?
No, because two lines of different elevations cannot meet, except on a vertical cliff or overhang where they merge or appear to touch.
How does a spot elevation differ from a contour?
A spot elevation is one measured height at one point. In contrast, a contour line joins many points of the same height and is usually interpolated from spot elevations.
Which tool is best for measuring contour lines?
For small sites, an automatic level and rod is accurate and affordable. For large open land, a GNSS rover or drone is faster, and lidar suits forested terrain.
How do you read a depression on a contour map?
A depression shows as a closed ring with small tick marks pointing inward, toward the lower ground. Therefore, the elevation drops toward the center.
Contour Lines: The Bottom Line
To sum up, contour lines come from careful elevation readings, simple interpolation and a constant interval. Close spacing means steep ground, and wide spacing means gentle ground. First, start with a benchmark, shoot a grid and add break points, then draw the lines and check them against the site.
Finally, use the slope calculator above whenever you need to turn line spacing into a grade or an angle. For anything that goes on a permit, however, hand the job to a licensed surveyor.
1 thought on “How to Measure and Map Contour Lines for Land Development”