

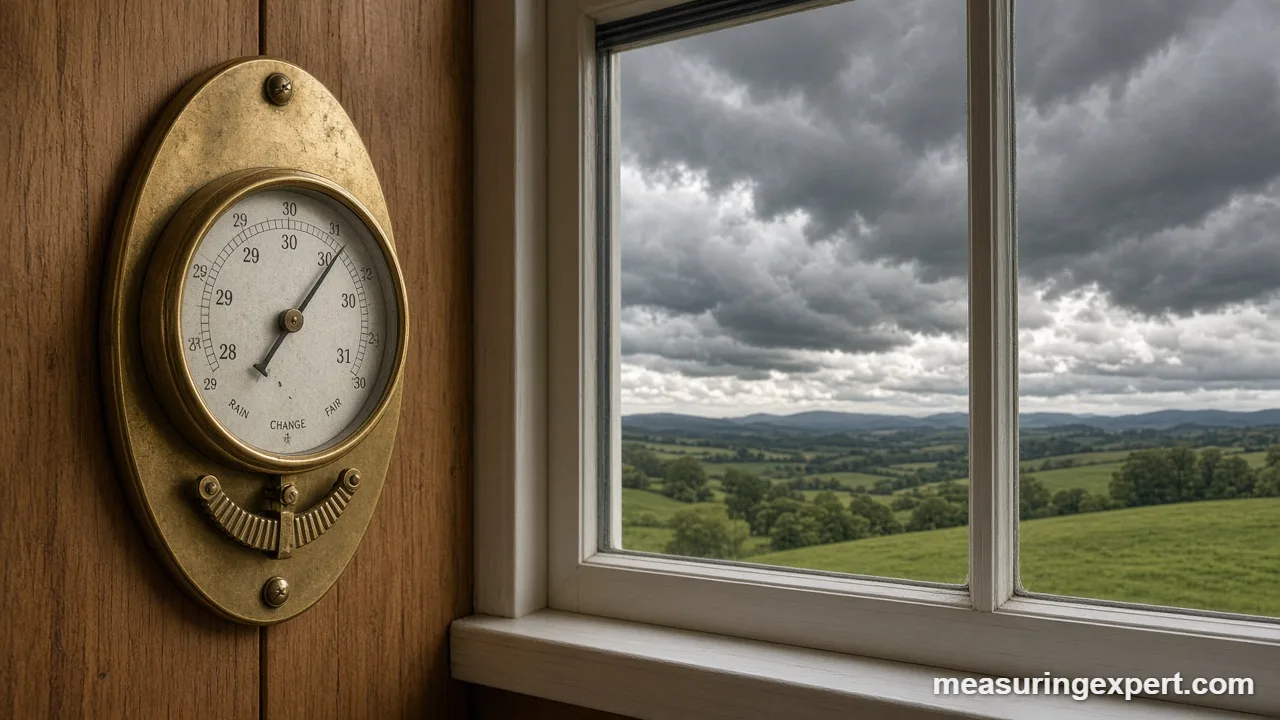
Air pressure and weather are linked because air moves from high pressure to low pressure. High pressure (above about 1013 hPa or 29.92 inHg) usually means sinking air and calm, dry skies. Low pressure means rising air, clouds and rain. So a steadily falling barometer often warns of a storm, while a rising one signals clearing.
Long before satellites and computer models, sailors and farmers watched a glass tube of mercury to guess tomorrow’s weather. As it turns out, they were onto something real. In fact, the weight of the air above you changes from day to day, and those small changes tell you which kind of air mass is moving in.
Why Pressure Changes Shape the Weather
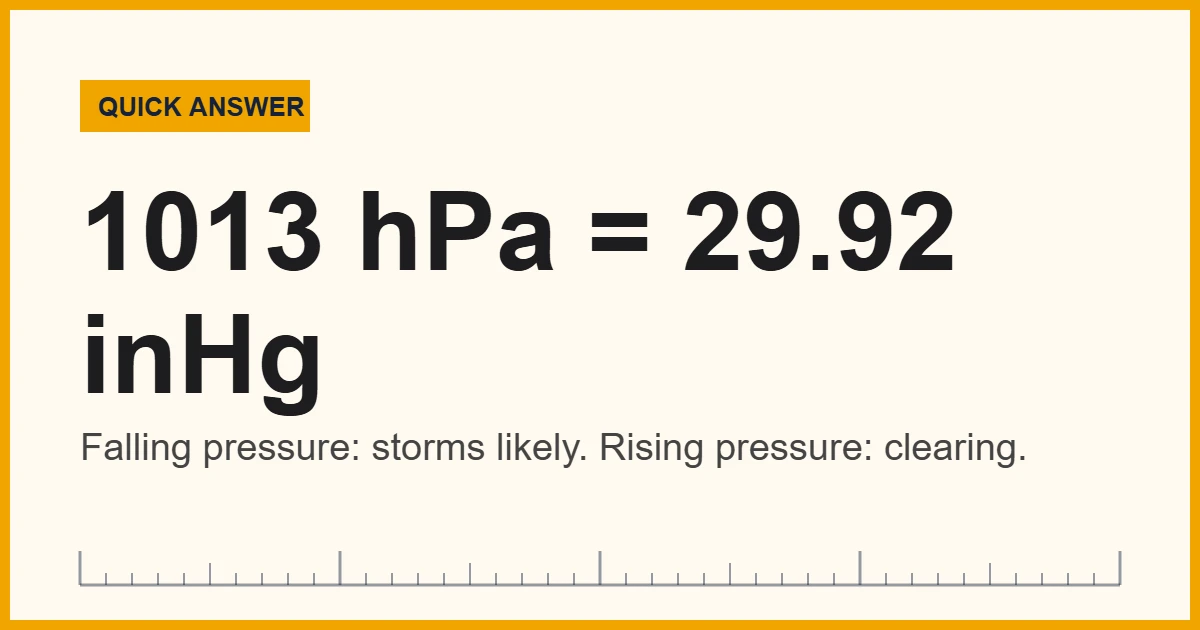
Here is the direct answer. A barometer measures air pressure, the weight of the column of air pressing down on every square inch of ground. At sea level, the standard value is 1013.25 hectopascals (hPa), which equals 29.92 inches of mercury (inHg) or about 14.7 psi. Areas of higher pressure have sinking air, which warms and dries out, so clouds struggle to form. In contrast, areas of lower pressure have rising air, which cools, condenses into clouds and often produces rain or snow. Because wind blows from high toward low pressure, the difference between the two also sets wind speed. Finally, the trend matters more than any single number: a fast drop usually means a storm is approaching.
In short: the number on a barometer is a snapshot, but the direction it moves over three to twelve hours is the forecast.
The National Oceanic and Atmospheric Administration (NOAA) explains this in its JetStream guide to air pressure. According to NOAA, falling pressure points to stormy, wet and windy weather, whereas rising pressure points to fair weather. NOAA also notes that weather stations adjust their readings to sea level so that every station can be compared on one map.
Below, you will find a converter for barometer units, a plain-English guide to highs and lows, a comparison of barometer types, and a step-by-step method for reading the weather from your own instrument.
Convert Barometer Readings Between inHg, kPa, psi and mmHg
US forecasts give pressure in inches of mercury, while most other countries use hectopascals (hPa), which are the same as millibars (mb). This converter uses kilopascals instead, so simply multiply the kPa result by 10 to get hPa. For example, 29.92 inHg gives 101.3 kPa, which is 1013 hPa.
Recommended Tools for Tracking Air Pressure at Home
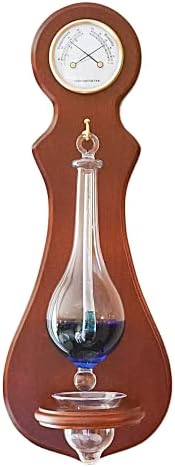
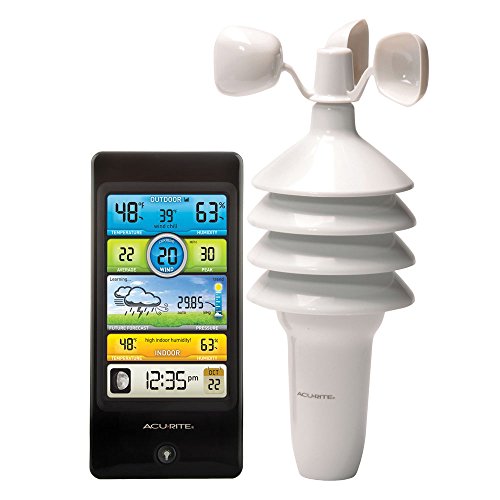
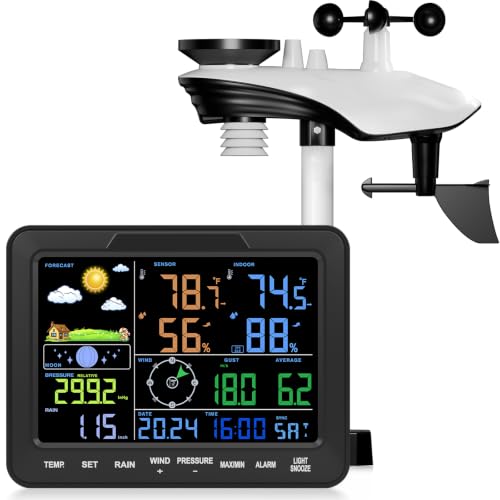
You do not need a lab instrument to follow the weather. However, a few features make a real difference. First, choose a model you can set to your local sea-level pressure; otherwise every reading is offset by your elevation. Next, look for a pressure history graph or trend arrow, because the trend is what predicts the weather. Also, a digital barometer with a stated accuracy is the better choice if you want numbers you can compare with the official reports.



As an Amazon Associate, Measuring Expert earns from qualifying purchases.
Key Takeaways
- Standard sea-level pressure is 1013.25 hPa, 29.92 inHg, 101.325 kPa or about 14.7 psi.
- High pressure brings sinking air and usually fair, settled weather.
- Low pressure brings rising air, clouds, rain and stronger wind.
- Wind blows from high to low pressure; tightly packed isobars mean strong wind.
- A falling barometer over several hours is the classic warning sign of a storm.
- Home barometers must be set to local sea-level pressure to match forecasts.
- Pressure is only one clue; official forecasts also use temperature, humidity, wind and models.
Air Pressure and Weather: What a Barometer Actually Measures
First of all, air has weight. A column of air one inch square, reaching from sea level to the top of the atmosphere, weighs about 14.7 pounds. Moreover, that weight pushes on everything around you, and a barometer measures it. Because air molecules move in every direction, the push comes from all sides, so you do not feel it.
The weight of that column is not constant, however. When a mass of cold, dense air settles over a region, the column gets heavier and the barometer rises. Similarly, when warm, moist air rises over a region, air flows out at the top of the column, so the column gets lighter and the barometer falls. In other words, the barometer is a scale for the sky above you.
Elevation also changes the reading. Near sea level, pressure drops by roughly 1 inHg for every 1,000 feet you climb, about 36 hPa. For example, the standard atmosphere gives about 834 hPa (24.6 inHg) at Denver’s elevation of 5,280 feet. That is why weather services convert every station reading to its sea-level equivalent before they draw a map. For more on how pressure works in gases generally, see our guide to which measurement describes the pressure of a gas.
How Highs and Lows Connect Air Pressure and Weather
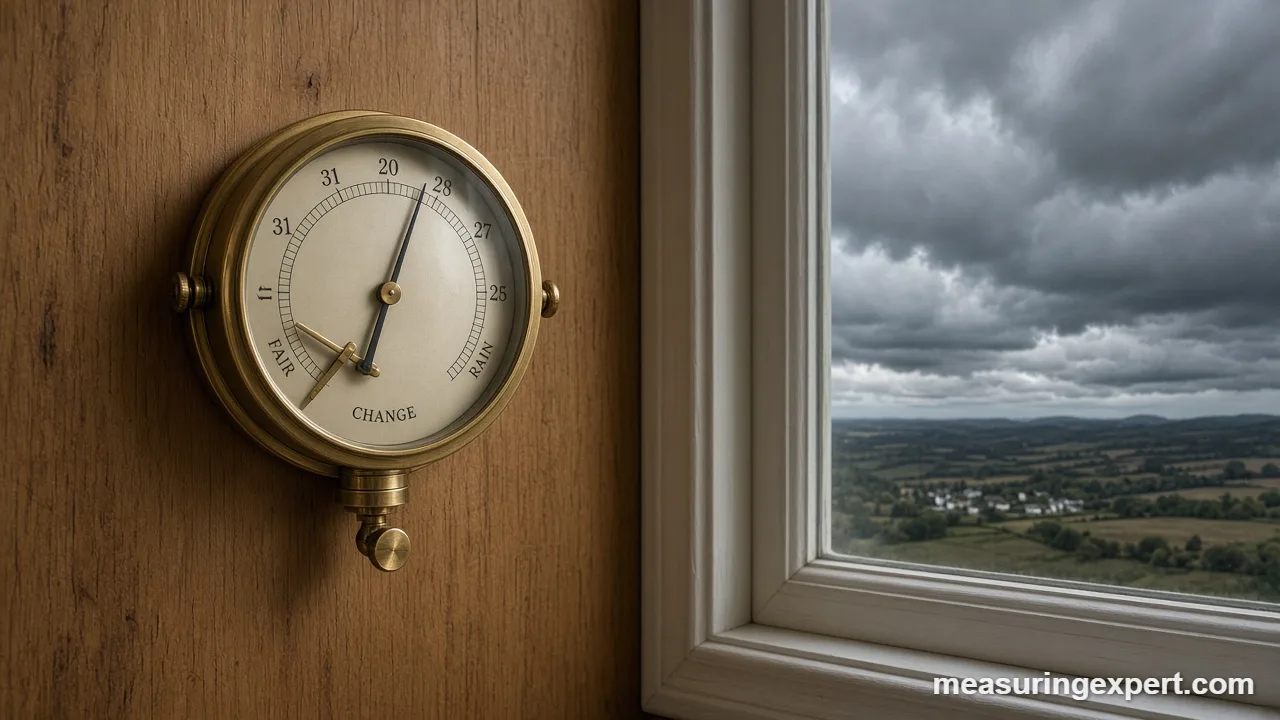
On a weather map, a blue H marks a high-pressure center and a red L marks a low. The lines around them are isobars, lines of equal pressure. US surface maps usually draw them every 4 millibars. Here is what each system does:
| Feature | High pressure (H) | Low pressure (L) |
|---|---|---|
| Air motion | Sinks toward the ground and spreads out | Flows in at the ground and rises |
| Spin (Northern Hemisphere) | Clockwise | Counterclockwise |
| Clouds and rain | Few clouds; sinking air warms and dries | Clouds and rain or snow; rising air cools and condenses |
| Typical sea-level reading | Above about 1020 hPa (30.12 inHg) | Below about 1000 hPa (29.53 inHg) |
| Wind | Usually light near the center | Often strong, especially near fronts |
| Season quirks | Can trap fog, haze and cold air in winter | Strongest storms in fall, winter and spring in mid-latitudes |
Wind is the bridge between the two. Air always tries to move from high to low pressure, but Earth’s rotation bends its path, so it ends up circling the centers instead of flowing straight in. As a result, the closer the isobars sit on a map, the stronger the wind. Meanwhile, fronts, the boundaries between warm and cold air masses, almost always trail from a low. That is why a dropping barometer and a wind shift often arrive together.
Reading Pressure Units: hPa, mb, inHg and psi
In practice, different countries and professions report the same pressure in different units. Consequently, this causes most of the confusion about barometer readings. The numbers below all describe standard sea-level pressure.
| Unit | Standard sea level | Who uses it |
|---|---|---|
| Hectopascal (hPa) | 1013.25 hPa | Most weather services worldwide |
| Millibar (mb) | 1013.25 mb (1 mb = 1 hPa) | US weather maps, hurricane advisories |
| Inch of mercury (inHg) | 29.92 inHg | US TV forecasts, aviation altimeters |
| Kilopascal (kPa) | 101.325 kPa | Canadian forecasts, science classes |
| Millimeter of mercury (mmHg) | 760 mmHg | Older instruments, Russia, medicine |
| Pound per square inch (psi) | 14.696 psi | Engineering, tire and gauge pressure |
One more distinction matters. Station pressure is what the instrument actually reads at its own elevation. Sea-level pressure, by contrast, is that reading adjusted to sea level, and it is the number you hear on the news. Pilots use a third value, the altimeter setting, which is close to sea-level pressure but uses a slightly different formula. Our overview of units of measurement in science covers the pascal and other SI units in more depth.
Air Pressure and Weather Instruments: Barometer Types Compared
All barometers measure the same thing, but they do it in very different ways. Therefore, choose by how you plan to use the readings.
| Type | How it works | Strengths | Weaknesses |
|---|---|---|---|
| Mercury barometer | Air pressure holds up a column of mercury in a glass tube (Torricelli, 1643) | Very accurate reference instrument | Fragile, toxic mercury; now rare and restricted |
| Aneroid barometer | A sealed metal capsule flexes as pressure changes and moves a needle | No liquid, no batteries, classic dial | Needs setting to local pressure; can drift over time |
| Digital sensor | A tiny electronic pressure sensor (in weather stations and phones) | Logs history, shows trends, easy to read | Accuracy depends on the sensor and calibration |
| Barograph | An aneroid capsule moves a pen across a rotating paper drum | Draws the pressure trend for a full week | Expensive, needs paper and ink |
| Storm glass | Crystals form in a sealed liquid | Decorative | Responds mainly to temperature, not a real pressure gauge |
For most people, a home weather station with a digital barometer is the practical choice, because it records the trend for you. Our guide to the best weather stations compares models that also log temperature, humidity, wind and rain.
How to Forecast the Weather With a Home Barometer
- Set it to local sea-level pressure. Look up the current pressure from your nearest airport or National Weather Service station, then adjust the dial or settings to match.
- Record a reading at the same times each day. Morning and evening work well, and a digital station can do this automatically.
- Check the three-hour trend. Professional observers report the change over three hours, so compare your current reading with the one from three hours ago.
- Compare the trend with the sky and wind. A falling barometer with thickening high clouds and a shifting wind is a stronger signal than pressure alone.
- Judge the speed of the change. As a rough rule, a change of a few hPa (around 0.1 inHg) or more in three hours suggests a fast-moving system.
- Confirm with an official forecast. Use your readings to understand the forecast, not to replace it, especially before travel or outdoor work.
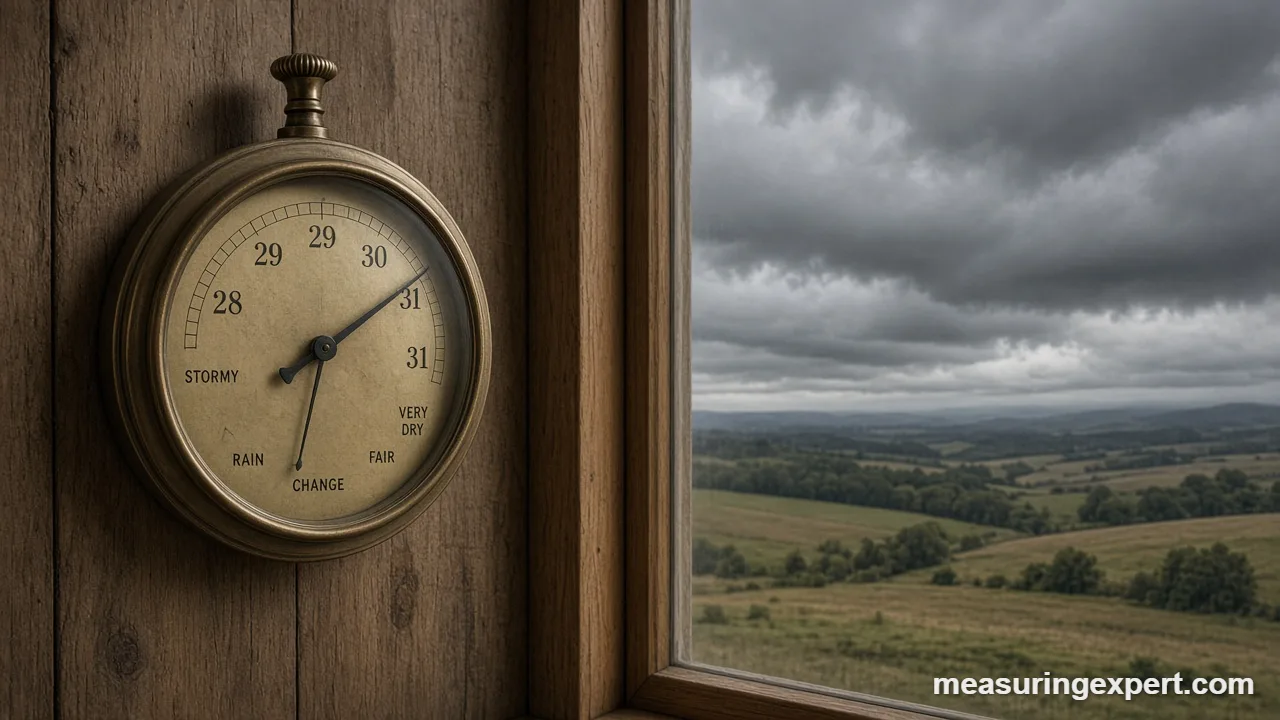
Next, here is how to read the trend once you have it:
| Barometer trend | Usual meaning |
|---|---|
| Rising steadily | Clearing skies and drier air on the way |
| Rising quickly after a storm | Clearing, but often with gusty wind for a while |
| Steady and high | Settled weather likely to continue |
| Falling slowly | Clouds and possible rain within a day or so |
| Falling quickly | Storm, strong wind or heavy rain approaching soon |
Do and Don’t When Reading a Barometer
Do
- Set the barometer to your local sea-level pressure.
- Watch the trend over several hours.
- Mount it indoors, away from heaters and direct sun.
- Note wind direction and cloud type alongside pressure.
- Check the setting against an official report every few months.
Don’t
- Trust the “Rain” or “Fair” words on a dial at face value.
- Compare station pressure with sea-level reports.
- Judge the weather from one reading in isolation.
- Rely on a storm glass as a real pressure gauge.
- Ignore official warnings because your barometer looks steady.
Honest Limits of Air Pressure and Weather Forecasting
Pressure readings are a useful clue, yet they cannot tell the whole story. For one thing, thunderstorms can form on a summer afternoon with almost no change in pressure, because they depend on heat and humidity more than on large weather systems. Likewise, tropical regions see very little day-to-day pressure change outside of tropical cyclones. In addition, pressure rises and falls slightly twice a day because of atmospheric tides, so a small morning rise is not always a sign of better weather.
The words printed on old barometer dials also mislead people. A reading of 29.0 inHg labeled “Stormy” might be perfectly normal on a mountain, and 30.4 inHg labeled “Very Dry” can come with freezing fog. Instead, think of the dial words as a rough sea-level guide from the 1800s.
The extremes show how wide the range really is. According to the World Meteorological Organization’s records table, the highest sea-level pressure on record is 1083.8 hPa (32.00 inHg), measured at Agata, Russia, in 1968. By contrast, the lowest outside a tornado is 870 hPa (25.69 inHg), in the eye of Typhoon Tip in 1979. Most everyday readings, however, stay roughly between 29.5 and 30.5 inHg.
When to Rely on Professional Forecasts
A home barometer is a great teaching tool and a good short-range guide. Even so, professional meteorologists combine pressure data from thousands of stations, weather balloons, satellites, radar and computer models. As a result, they can forecast days ahead, while a single barometer only hints at the next 12 to 24 hours.
So turn to official forecasts before boating, flying, hiking at altitude or planning work outdoors. Pilots, in particular, must use the official altimeter setting from air traffic control or an airport weather report, not a home instrument. Similarly, if your barometer seems wrong, a calibration lab or the manufacturer can check it against a reference standard.
Frequently Asked Questions
How are air pressure and weather related?
Air moves from high to low pressure. High pressure brings sinking air and fair weather, while low pressure brings rising air, clouds, rain and wind. So the pressure pattern shapes the weather you get.
What is normal barometric pressure?
Standard sea-level pressure is 1013.25 hPa, which equals 29.92 inHg or about 14.7 psi. Everyday readings usually fall between about 29.5 and 30.5 inHg.
Does falling air pressure mean rain?
Often, yes. A steady fall over several hours usually means a low or front is approaching, which brings clouds and rain or snow. However, a slow fall does not always produce rain.
What barometric reading counts as high or low pressure?
As a rough guide, readings above about 1020 hPa (30.12 inHg) are high and readings below about 1000 hPa (29.53 inHg) are low. Weather maps label highs and lows relative to the surrounding area.
Why does air pressure and weather data use sea-level values?
Pressure drops about 1 inHg per 1,000 feet of elevation. Converting every station to sea level removes that effect, so forecasters can compare stations and draw isobars on one map.
How fast does pressure change before a storm?
As a rough rule, a drop of a few hPa (around 0.1 inHg) or more in three hours suggests a fast-moving system. A bomb cyclone falls at least 24 mb in 24 hours at 60 degrees latitude.
Can air pressure and weather changes affect how I feel?
Some people report headaches or joint pain when pressure changes, but individual responses vary. If symptoms bother you, talk to a doctor rather than relying on a barometer.
Is a phone barometer accurate enough?
Many phones have a pressure sensor that tracks trends well. However, the absolute value may need correcting to sea level, so compare it with a nearby official report.
What is the difference between hPa and mb?
There is no difference in size. One hectopascal equals one millibar, so 1013 hPa is the same as 1013 mb.
What are the records for air pressure and weather extremes?
The highest sea-level pressure on record is 1083.8 hPa at Agata, Russia, in 1968. The lowest outside a tornado is 870 hPa, in Typhoon Tip in 1979.
Air Pressure and Weather: The Bottom Line
To sum up, air pressure and weather move together because air flows from high to low pressure. Highs bring sinking air and calm, dry days, whereas lows bring rising air, clouds, rain and wind. Standard sea-level pressure is 1013.25 hPa or 29.92 inHg, and the trend over a few hours tells you more than any single reading.
Finally, set your barometer to local sea-level pressure, watch how it changes, and compare it with the sky and the wind. Use it to understand the forecast, and always follow official warnings when the weather turns dangerous.