

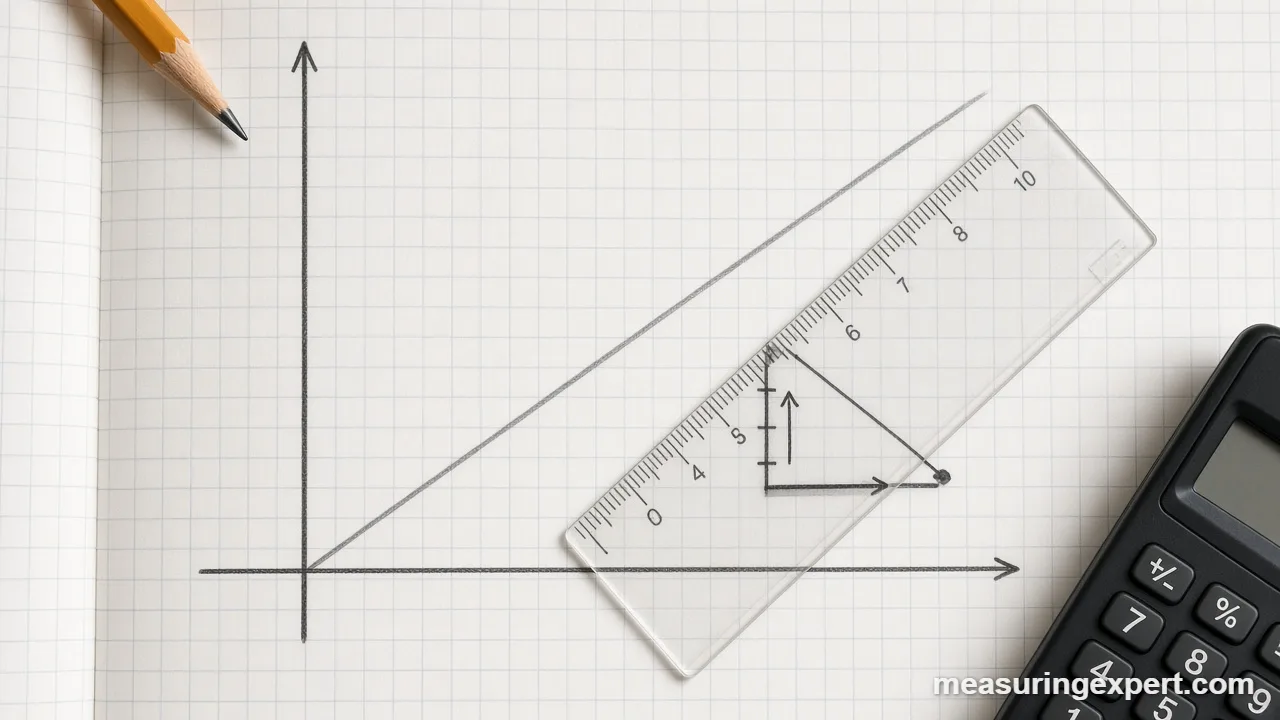
To use slope to find speed, pick two points on a distance-time graph and divide the rise (change in distance) by the run (change in time). For example, 150 m covered in 10 s gives a slope of 15 m/s. A straight line means constant speed, while a curve needs a tangent line for instantaneous speed.
Distance-time graphs show up in middle school science, high school physics, driver training and even fitness apps. They all hide the same answer in plain sight: the steepness of the line is the speed. So once you can read the steepness, you can read the speed at any moment of the trip.
The method is short. First, choose two points on the line. Next, find how far the distance changed (the rise) and how much time passed (the run). Then divide rise by run and keep the units, because meters over seconds gives meters per second and miles over hours gives miles per hour. A steeper line gives a bigger number, a flat line means the object is standing still, and a line that slopes downward means it is coming back toward the start.
In short: speed = rise / run = change in distance / change in time, and the slope of a velocity-time graph gives acceleration instead of speed.
This guide follows the approach in the free OpenStax textbook Physics, section 2.3 (position vs. time graphs), which explains that the slope of a position-time graph is velocity and that a tangent line gives the instantaneous value. Its section 3.2 also states that the slope of a velocity-time graph is acceleration.
Below you will find the formula, a converter for your answer, six worked examples, and the mistakes that cost students the most marks.
Convert the Speed You Get From a Slope
Your slope comes out in whatever units the graph axes use. Type the result below to see it in meters per second, km/h, mph, feet per second and knots. For instance, a slope of 15 m/s is 54 km/h, or about 33.55 mph.
The converter handles units only. Instead of reading the graph for you, it takes the slope you worked out by hand and expresses it in the units you need.
Recommended Tools for Measuring Distance and Time
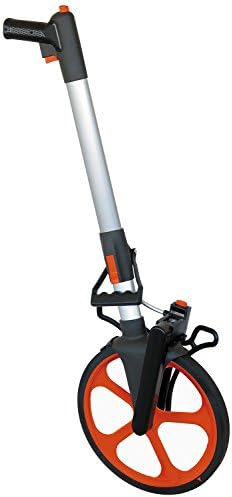
To build your own distance-time graph, you need a reliable distance and a reliable time. A measuring wheel or long tape marks out a course, while a stopwatch records split times at each marker. In addition, a graphing calculator draws the line and finds its slope for you, and graph paper keeps hand-drawn plots neat.





As an Amazon Associate, Measuring Expert earns from qualifying purchases.
Key Takeaways
- Slope = rise / run. On a distance-time graph, that is change in distance divided by change in time, which equals speed.
- Units come straight from the axes: m and s give m/s, km and h give km/h, miles and hours give mph.
- A straight line means constant speed, so any two points give the same answer.
- Average speed uses two points on the curve; instantaneous speed uses the slope of a tangent at one point.
- A flat line means zero speed; a downward line means moving back toward the start.
- On a velocity-time graph, the slope is acceleration, and the area under the line is the distance traveled.
The Formula: Slope to Find Speed With Units
Slope measures how much one quantity changes for each unit of another. On a distance-time graph, distance sits on the vertical (y) axis and time sits on the horizontal (x) axis. Therefore the slope tells you how many meters (or miles) the object covers for each second (or hour) that passes, and that is exactly what speed means.
Keep the units attached at every step, because they tell you what the answer means. For example, if the rise is 150 m and the run is 10 s, the slope is 150 m / 10 s = 15 m/s. Similarly, a rise of 3 miles over a run of 0.4 hours gives 7.5 mph.
| Vertical axis (rise) | Horizontal axis (run) | Slope unit |
|---|---|---|
| meters (m) | seconds (s) | m/s |
| kilometers (km) | hours (h) | km/h |
| miles (mi) | hours (h) | mph |
| feet (ft) | seconds (s) | ft/s |
| meters (m) | minutes (min) | m/min (divide by 60 for m/s) |
How to Use Slope to Find Speed, Step by Step
- Check the axes. Confirm distance (or position) is on the y-axis and time is on the x-axis, and note the units of each.
- Pick two points on the line. Choose points far apart on grid intersections, for example (2 s, 30 m) and (8 s, 120 m).
- Find the rise. Subtract the first distance from the second: 120 m – 30 m = 90 m.
- Find the run. Subtract the first time from the second: 8 s – 2 s = 6 s.
- Divide rise by run. 90 m / 6 s = 15 m/s. This value is the speed over that stretch.
- Convert if needed. Enter the result in the converter above to get km/h or mph.
Always subtract in the same order for both values. Otherwise the sign flips and a forward-moving object appears to move backward.

Worked Examples: Slope to Find Speed
Each example below was recomputed from the numbers shown, so you can follow every step.
Example 1: Slope to find speed of a car
A straight line passes through (0 s, 0 m) and (10 s, 150 m). The rise is 150 m and the run is 10 s, so the speed is 15 m/s. That equals 54 km/h, or about 33.55 mph.
Example 2: A runner in miles and minutes
A runner’s graph shows 3 miles after 24 minutes. The slope is 3 mi / 24 min = 0.125 miles per minute. Next, multiply by 60 to get 7.5 mph, which is about 12.07 km/h.
Example 3: Feet and seconds
A car covers 264 ft in 3 s on a straight line. So the slope is 88 ft/s, which works out to exactly 60 mph (about 96.56 km/h).
Example 4: A walker heading home
The line falls from (2 min, 400 m) to (6 min, 100 m). The rise is -300 m and the run is 4 min, so the slope is -75 m/min. The minus sign shows direction (back toward the start), while the speed itself is 75 m/min, or 1.25 m/s (4.5 km/h, about 2.8 mph).
Example 5: A trip with a stop
A bus covers 6 km in the first 10 minutes, waits 10 minutes, and then covers 10 km in the next 20 minutes. The three segment slopes are 36 km/h, 0 km/h and 30 km/h. Meanwhile, the average speed for the whole trip is 16 km / 40 min = 24 km/h (about 14.91 mph), which is the slope of a straight line joining the first and last points.
Example 6: Slope to find speed on a curve
A cart speeds up so its distance follows d = 2t squared (meters and seconds). Between 0 s and 4 s, it moves 32 m, so its average speed is 32 m / 4 s = 8 m/s. At exactly 3 s, however, a tangent touches the curve at (3 s, 18 m) and passes through (2 s, 6 m) and (4 s, 30 m). Its slope is 24 m / 2 s = 12 m/s, which is the instantaneous speed at 3 s.
What the Shape of the Line Tells You
Before you calculate anything, the shape of the graph already tells you a lot. In fact, many exam questions only ask you to describe the motion, not to compute it.
| Line shape | Slope | What the object is doing |
|---|---|---|
| Straight, steep upward | Large, positive, constant | Moving away fast at a steady speed |
| Straight, gentle upward | Small, positive, constant | Moving away slowly at a steady speed |
| Horizontal | Zero | Stopped |
| Straight, downward | Negative, constant | Returning toward the start at a steady speed |
| Curving upward (getting steeper) | Increasing | Speeding up |
| Curving and leveling off | Decreasing | Slowing down |
Average vs Instantaneous Speed From a Slope
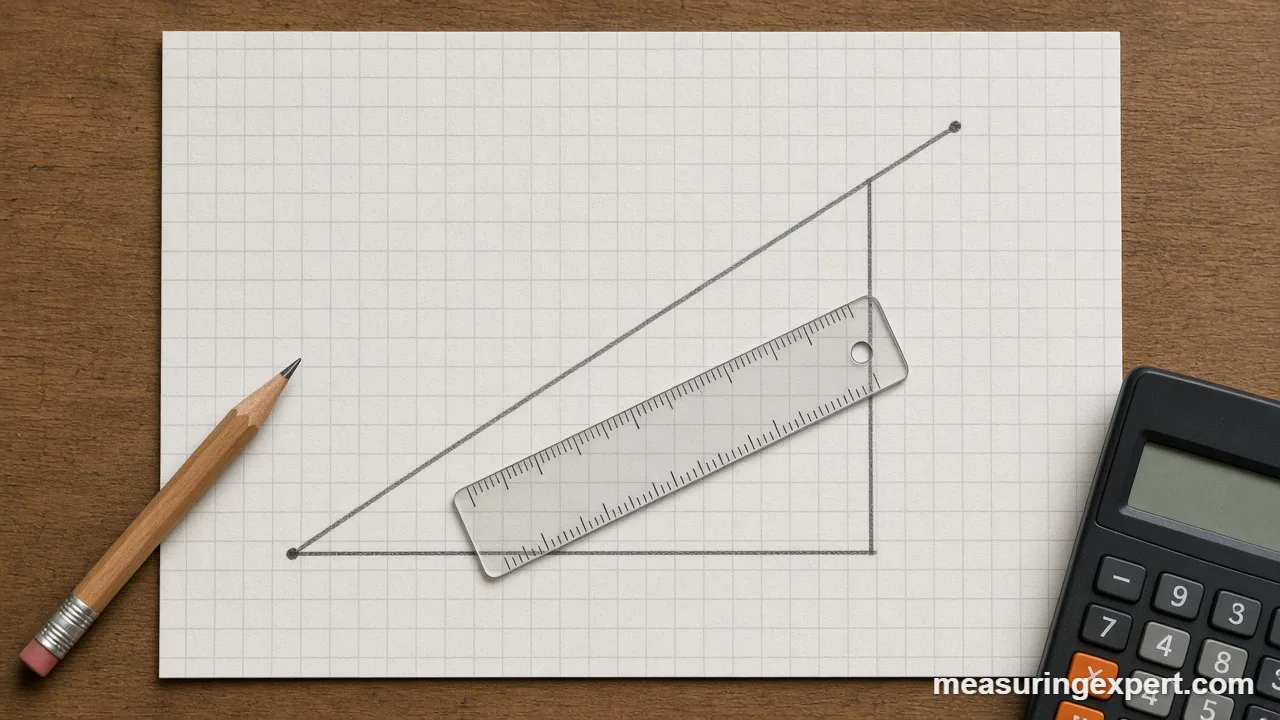
On a straight line, every pair of points gives the same slope. A curved line is different, because its steepness changes from moment to moment. So you need to decide which speed the question wants.
| People often confuse | How to find it on the graph | What it means |
|---|---|---|
| Average speed | Slope of a straight line (secant) joining two points on the curve | Total distance divided by total time for that interval |
| Instantaneous speed | Slope of the tangent line that just touches the curve at one point | How fast the object moves at that exact moment |
To draw a tangent by hand, lay a ruler so it touches the curve at your chosen point without cutting across it. Then extend the line well past the curve, pick two far-apart points on the ruler line (not on the curve), and use slope to find speed from those two points. Longer tangent lines reduce reading errors, because small misreads matter less over a big rise and run.
Velocity-Time Graphs: The Slope Is Acceleration
Students often apply the same rule to a velocity-time graph and get the wrong quantity. On that graph, speed or velocity sits on the y-axis, so rise / run is change in velocity divided by change in time. That is acceleration, not speed.
For example, a car that goes from 0 to 27 m/s in 9 s has a slope of 3 m/s squared. Likewise, 0 to 60 mph (26.82 m/s) in 8 s is about 3.35 m/s squared. On a velocity-time graph, you read speed directly off the y-axis, and the area under the line gives the distance covered.
A downward slope here means the object is slowing down. Braking problems use exactly this idea, so if you want to work out how long a car needs to stop, see our guide on how to calculate stopping time.
Do and Don’t When Reading Slopes
Do
- Read both axis labels and units first.
- Pick points far apart on grid intersections.
- Subtract in the same order for rise and run.
- Write units at every step of the division.
- Use a tangent for speed at a single instant.
Don’t
- Divide a single distance by a single time on a curve.
- Count gridline squares when the axes use different scales.
- Treat a velocity-time slope as speed.
- Forget to convert minutes to hours for mph.
- Report a negative speed; the sign belongs to velocity.
Honest Limits of Using Slope to Find Speed
The slope method is exact for an ideal graph, but real graphs carry reading errors. For one thing, hand-drawn tangents vary from person to person, so two students can get slightly different instantaneous speeds from the same curve. Moreover, data from a stopwatch includes reaction time, which can easily add or remove a tenth of a second at each split. Finally, a slope gives speed along the measured path only; it says nothing about direction changes that the graph does not show. In short, treat a hand-read slope as good to two or three significant figures, and quote your answer to match.
When to Ask a Professional
For homework and lab reports, the slope method is all you need. However, some real-world speed questions carry legal or safety weight. Crash reconstruction, speeding disputes and vehicle data recorder analysis rely on calibrated equipment and trained analysts, so a hand-drawn graph is not evidence. Similarly, sports timing for records uses certified systems, not phone stopwatches.
Frequently Asked Questions
How do you use slope to find speed on a graph?
Pick two points on a distance-time graph, subtract the distances to get the rise, subtract the times to get the run, and divide rise by run. The result, with its units, is the speed.
What does the slope of a distance-time graph represent?
It represents speed. A steeper slope means a higher speed, a flat line means the object is stopped, and on a position graph a negative slope means it is moving back toward the start.
What units does slope to find speed give?
The units are the y-axis unit divided by the x-axis unit. Meters and seconds give m/s, kilometers and hours give km/h, and miles and hours give mph.
How do you find instantaneous speed from a curved graph?
Draw a tangent line that touches the curve at the moment you care about, then find the slope of that tangent using two far-apart points on the line.
How is average speed different from instantaneous speed?
Average speed is total distance divided by total time, the slope of a straight line joining two points. Instantaneous speed is the slope of the tangent at one point.
Does slope to find speed work on a velocity-time graph?
No. On a velocity-time graph, the slope gives acceleration. Instead, read speed straight off the y-axis, and use the area under the line for distance.
What does a horizontal line on a distance-time graph mean?
A horizontal line has zero slope, so the object is not moving during that time.
Can speed from a slope be negative?
Speed cannot be negative. A negative slope on a position-time graph gives a negative velocity, which means motion back toward the start; the speed is the size of that value.
How do I convert a slope in meters per minute to meters per second?
Divide by 60. For example, 75 m/min is 1.25 m/s, which is 4.5 km/h or about 2.8 mph.
Why do my slope to find speed answers differ from my classmates?
Usually because of reading errors. Points close together, rough tangents or values read between gridlines all shift the result slightly, so pick far-apart points on grid intersections.
Slope to Find Speed: The Bottom Line
To sum up, the slope of a distance-time graph is the speed: rise divided by run, with the axis units carried through. Straight lines give one constant speed, curves need a tangent for the speed at an instant, and a straight line joining two points gives the average speed between them.
Finally, remember that the same rise-over-run on a velocity-time graph gives acceleration instead. Read the axes first, use slope to find speed, and then convert your answer with the tool at the top of this page.
1 thought on “How to Use Slope to Find Speed (Distance-Time Graphs Explained)”