

Construction equipment data is measured by sensors and telematics units that log engine hours, idle time, fuel use and location, then send those logs to a cloud dashboard. To analyze it, turn each log into a rate, such as gallons per hour or percent idle, and compare machines over the same work period.
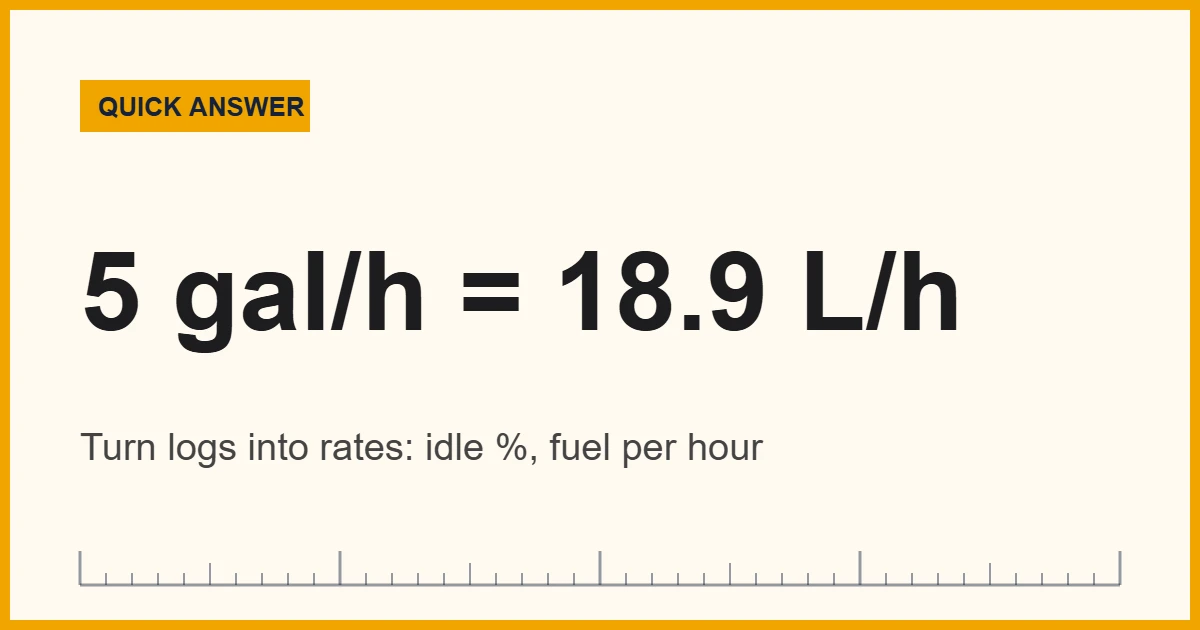
Convert Fuel Burn Between Gallons and Liters
Fuel burn is the most common rate in machine reports, and US and metric dashboards report it in different units. Enter a fuel amount below to see it in liters, quarts and more. One US gallon is exactly 3.785411784 liters.
Construction Equipment Data at a Glance
First, a modern excavator, loader or dozer is a rolling data source. Sensors on the engine, hydraulics and tracks feed a small computer, and a modem passes the readings to a server. As a result, a manager can see what a machine did all day without leaving the office.
However, the hard part is not collecting the numbers. It is knowing which ones matter and how to turn them into decisions. Raw logs of hours, liters and coordinates do little until you convert them into rates that you can compare.
In short: pick a few signals, define each one clearly, calculate the same rates every week, and compare each machine with its own history. That habit finds idle time, fuel waste and early faults far better than a pile of unread reports.
Standards help here. For example, ISO/TS 15143-3 specifies a communication schema for sending mobile machinery status data from a telematics provider’s server to customer applications, so that data from different makers can be read in one place. Meanwhile, GPS.gov explains how augmentation systems can improve positioning, which matters for location logs.
Key Takeaways
- Core signals are engine hours, idle time, fuel used, location and fault codes.
- Rates beat raw totals: use percent idle, gallons per hour and fuel per cubic yard.
- Define every metric in writing, so every site calculates it the same way.
- Check sensor data against a hand check, such as a metered fuel fill.
- Compare each machine with its own baseline before you compare it with others.
- Telematics data can show where operators are, so set clear rules for who sees it.
- Use the converter above to keep gallons and liters straight.
- Recommended tools to track construction equipment data
- What smart machines record
- Where construction equipment data comes from
- Metrics and formulas
- How to measure construction equipment data step by step
- How telematics data reaches your dashboard
- How to analyze construction equipment data
- Checking data quality
- Common mistakes
- Do and don’t
- Honest limits
- When to call a professional
- FAQs
Recommended Tools to Track Construction Equipment Data
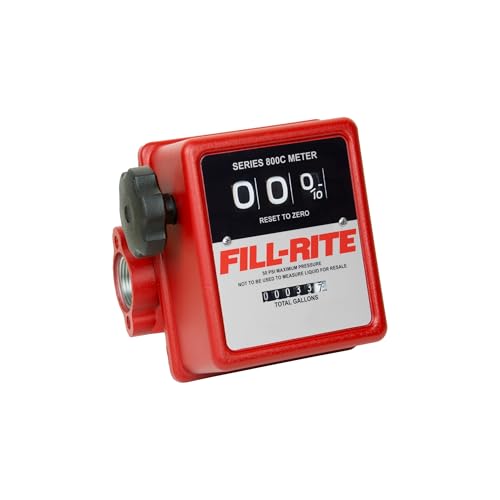
Large machines usually ship with factory telematics. However, small equipment, rental fleets and fuel tanks often have no built-in tracking. These add-on tools, therefore, fill the gaps. A transfer meter records the fuel you pour into a machine, an hour meter counts running time on small engines, and a GPS tracker logs where a trailer or attachment goes. Check each listing for the power source, the units shown and whether a subscription is needed.


As an Amazon Associate, Measuring Expert earns from qualifying purchases.
What Smart Machines Record
Most smart machines log the same handful of signals, so the table below lists them with the unit you will usually see and what each one tells you.
| Signal | Usual unit | What it tells you |
|---|---|---|
| Engine hours | hours | How long the engine ran, which drives service intervals |
| Idle time | hours or percent | Time running without working, a major source of wasted fuel |
| Fuel used | gallons or liters | Consumption, which you turn into a burn rate |
| Fuel level | percent of tank | Refill timing and possible theft or leaks |
| Location | latitude and longitude | Where the machine is and whether it left the site |
| Coolant and hydraulic temperature | degrees F or C | Overheating and load |
| Hydraulic pressure | psi or bar | Load on the system and early leaks |
| Fault codes | text codes | Warnings from the engine and machine computers |
Operational Data
Operational data, for example, describes how the machine is used. It covers hours, idle time, fuel and location. In practice, these four signals answer most day-to-day questions.
Performance Data
Performance data, in contrast, describes how well the machine does its job. It includes output, such as cubic yards moved, and condition signals, such as temperature and pressure. For vibration-based condition checks on rotating parts, see our guide on how to measure vibration in mechanical systems.
Where Construction Equipment Data Comes From
Every number starts at a sensor or a human, so knowing the source tells you how far to trust it.
Onboard Sensors and the CAN Bus
First, engine and hydraulic sensors send readings to an electronic control unit. Many heavy machines then share those readings over a CAN bus, a wiring network built for vehicles. A telematics unit listens on that network, adds a clock and a GPS position, and sends the package onward by cellular link. The ISO/TS 15143-3 schema covers only the last step, from the provider’s server to your software, and leaves the on-board network out.
GPS and Positioning
Also, a GPS receiver gives the machine’s position and time. Accuracy depends on sky view and receiver quality. Standard receivers are good enough to show which site a machine is on. For grade control and survey work, however, crews add augmentation such as RTK corrections to reach centimeter-level positions, according to GPS.gov. Our piece on construction measurement precision explains why that difference matters.
Manual Logs
However, some facts never reach a sensor. Operator names, inspection notes, incident reports and fuel receipts still come from people. Because manual entries have more errors, keep the forms short and use drop-down lists where you can.
Metrics and Formulas for Machine Performance
Raw totals hide problems, so convert them into rates. These five cover most needs.
idle % = idle hours / engine hours x 100
fuel burn rate = fuel used / engine hours
fuel per output = fuel used / output (for example, cubic yards)
availability % = (scheduled hours – downtime hours) / scheduled hours x 100
| Metric | Why it matters | Watch out for |
|---|---|---|
| Utilization | Shows whether you own or rent more machine than you use | Scheduled hours must be defined the same way on every site |
| Idle percent | Finds wasted fuel and wear | Some idling is needed, for example warm-up or hydraulic work at rest |
| Fuel burn rate | Spots a machine that suddenly burns more | Depends on load, so compare similar tasks |
| Fuel per output | Links fuel to useful work | Needs a trustworthy output number |
| Availability | Shows how often the machine is ready to work | Count planned service separately from breakdowns |
Worked Example: One Excavator Day
For example, take a 10-hour shift. The engine ran for 6.0 hours, and 2.4 of those hours were idle. The machine used 30 gallons of diesel and moved 200 cubic yards of soil.
- Utilization is 6.0 / 10 x 100 = 60 percent.
- Idle share is 2.4 / 6.0 x 100 = 40 percent.
- Fuel burn rate is 30 / 6.0 = 5 gallons per hour, which is about 18.9 liters per hour.
- Fuel per output is 30 / 200 = 0.15 gallons per cubic yard, or about 0.74 liters per cubic meter.
Therefore, the 40 percent idle share is the first thing to question. If a change in work planning cut idle time from 2.4 hours to 1.2 hours, the machine would burn less fuel for the same work, although the exact saving depends on the idle fuel rate you measure.
How to Measure Construction Equipment Data Step by Step
- List the questions first. Decide what you want to know, such as idle time, fuel per yard or service timing.
- Choose the signals. Pick the few readings that answer those questions, and ignore the rest at first.
- Define each metric in writing. State the formula, the unit and the time window, such as scheduled hours per shift.
- Confirm what each machine reports. Check which signals the factory telematics unit or add-on logger supports.
- Test the sensors. Compare the logged fuel or hours with a metered fill and the hour meter on the dash.
- Collect on a fixed schedule. Export or sync the data daily or weekly, and use the same time zone for every machine.
- Calculate rates and compare. Turn totals into rates, then compare each machine with its own past weeks.
How Telematics Data Reaches Your Dashboard
Data takes a clear path. First, the sensor reads, the telematics unit packages, the provider’s server stores, and your software pulls the data in. Standards such as ISO/TS 15143-3 matter at the final step, since they let one dashboard read several makes of earth-moving machine.
Meanwhile, maker platforms bundle the steps into one product. Komatsu describes its Smart Construction tools as digital tools that link machines to office work, using drone and machine as-built data, GPS positioning, field records and remote telematics. Similarly, other makers offer comparable systems, and the idea is the same: one place to see the jobsite, with the machine data feeding a shared picture.
Reporting interval matters too. A unit that reports once a minute produces 1,440 records per machine per day. A unit that reports once an hour produces 24, which is enough for totals but not for short idle events.
For site surveying and as-built checks, our article on AI in construction measurement shows how the same data ideas apply to quantities and progress.
How to Analyze Construction Equipment Data
Analysis means comparing numbers and asking why they differ, but you do not need advanced software to begin.
Describe What Happened
First, start with simple summaries. Total hours, average idle percent and fuel per hour for each machine and week already show the outliers. Next, sort by the worst values and look at the top three.
Trends and Early Warnings
In short, a trend is a number followed over time. For example, a steady rise in fuel per hour on the same task can point to a clogged filter or worn parts. Likewise, a rising coolant temperature at the same load is worth a check. These signals do not diagnose a fault, but they tell a mechanic where to look first.
Set a Baseline for Construction Equipment Data
A baseline is a normal range for one machine doing one kind of work. Record it over several typical weeks. Then flag any reading that moves well outside that range. A new machine, a new operator or a new soil type can all shift the baseline, so reset it when conditions change.
Checking the Quality of Construction Equipment Data
Bad data leads to bad decisions, so test it regularly. Three quick checks catch most problems.
- Fuel. Add up what a metered pump delivered over a week and compare it with the total the machines logged. Large gaps point to sensor error or unlogged fills.
- Hours. Compare the telematics engine hours with the dash hour meter at the start and end of a month.
- Location. Check a few logged positions against known spots, such as the gate or the fuel tank.
Also look for gaps. A machine that reports nothing for a day may be out of coverage, switched off or have a loose antenna. For general advice on keeping instruments accurate, read our guide to measurement tool calibration.
Common Mistakes With Construction Equipment Data
- Counting everything. Dozens of metrics bury the few that matter.
- Mixing definitions. One site counts lunch breaks as idle, and another does not.
- Comparing unlike machines. A small loader and a large excavator burn fuel very differently.
- Ignoring load. Fuel per hour changes with the task, so compare similar work.
- Trusting a single day. Weather and schedules cause noise, so use weekly averages.
- Forgetting units. Gallons and liters get mixed up quickly across dashboards.
Do and Don’t When You Track Machine Data
Do
- Write down each formula and unit.
- Check sensor data against a hand measurement.
- Review the same few rates every week.
- Keep a baseline for each machine.
- Tell crews what is tracked and why.
Don’t
- Judge a machine on one day’s numbers.
- Compare machines of different sizes directly.
- Skip the units when sharing reports.
- Treat an alert as proof of a fault.
- Share operator location data without clear rules.
Honest Limits of Machine Data
Machine data describes what sensors saw, but not always what happened. First, a fuel sensor can read wrongly on a slope. Second, idle time depends on how the maker defines idle, so two brands may not match. Moreover, some work, such as holding a load or running a hydraulic hammer, looks like idling to a simple rule. Finally, data about people, such as operator names and locations, brings privacy and employment rules that vary by place. For these reasons, treat the numbers as strong clues and confirm them on site.
When to Call a Professional
Ask the equipment dealer or the telematics provider when you need to add a sensor, read manufacturer fault codes or change data-sharing settings. Likewise, ask a qualified technician before you act on a warning for a critical system such as brakes or hydraulics. Also, contact a lawyer or HR adviser about rules for tracking staff.
Frequently Asked Questions
What is data analysis in construction?
It means turning job and machine records into useful facts, such as how much fuel a machine uses per cubic yard or how much time it sits idle. Managers use these facts to plan work and control costs.
What is Komatsu Smart Construction?
It is Komatsu’s set of digital tools that links machines to office work. According to Komatsu, it uses design files, drone data, machine as-built data, GPS positioning and remote telematics.
What is smart construction equipment?
It is machinery fitted with sensors, a computer and a communication link. It logs what it does, such as hours, fuel and location, and sends that information to software.
How do you collect construction equipment data?
Use the machine’s built-in telematics or an add-on logger, then sync the data to a dashboard on a fixed schedule. Add manual logs for facts that sensors cannot see.
What is a good idle percentage for construction equipment data?
There is no single target. Idle share depends on the machine and the work, so set your own baseline over several typical weeks and aim to lower it from there.
How do I calculate fuel burn rate?
Divide the fuel used by the engine hours. For example, 30 gallons over 6 hours is 5 gallons per hour, or about 18.9 liters per hour.
How many liters are in a gallon of diesel?
One US gallon is 3.785411784 liters, so 5 gallons is about 18.93 liters.
How often should construction equipment data be reviewed?
Many fleets review key rates weekly and service data at each maintenance interval. Review faster for critical machines or when a trend moves quickly.
Can telematics data be trusted?
Mostly, but test it. Compare logged fuel with metered fills and logged hours with the dash hour meter, and fix any large gaps.
Do small contractors need telematics?
Not always. A small fleet can start with hour meters, fuel receipts and a weekly spreadsheet, then move to telematics when the number of machines grows.
Construction Equipment Data: The Bottom Line
Good construction equipment data comes from a few reliable signals, clear definitions and regular checks against real measurements. Turn totals into rates such as percent idle and gallons per hour, compare each machine with its own baseline, and keep units consistent.
Above all, start small. Track three numbers well before you add more, and use the converter at the top of the page to move between gallons and liters. Then bring in the dealer or provider for installs and for anything that touches safety.