


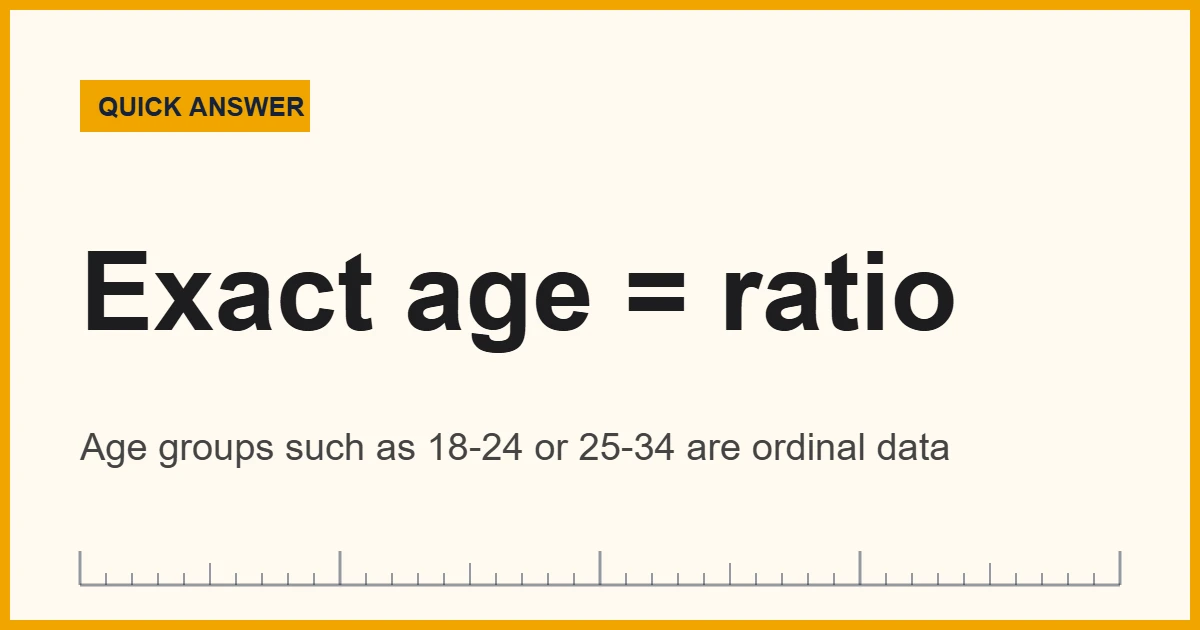
The age level of measurement is ratio when you record age as a number of years, months or days, because every unit is the same size and zero (the moment of birth) is a true starting point. However, once you sort people into ranges such as 18-24 or 25-34, age becomes ordinal data.
Age looks like the easiest variable in any survey. Everyone has one, and most people can state theirs without thinking. Yet students, researchers and analysts often get stuck on one exam-style question: what level of measurement is age? The honest answer is “it depends on how you wrote it down,” and that choice decides which statistics you can run later.
In short: exact age is ratio data, age groups are ordinal data, and birth year is interval data. So the same person can appear on three different scales in three different datasets.
The four levels themselves come from the psychologist S. S. Stevens. In 1946 he published On the Theory of Scales of Measurement in the journal Science, and his nominal, ordinal, interval and ratio scheme is still the standard framework in statistics courses. Similarly, the UCLA statistical consulting group explains in its guide to variable types that ordinal categories have a clear order but uneven spacing, which is exactly what happens when you bin ages.
Below, you will find a converter for ages in different time units, a plain table of the four levels, and a step list for deciding the level in your own data. After that, the page covers which statistics each level allows and where the usual textbook answer breaks down.
Convert an Age in Years to Months, Weeks and Days
Exact age stays on a ratio scale in any time unit, because changing units only multiplies every value by the same number. To see this, enter an age below and compare the results. The converter uses the Gregorian average year of 365.2425 days.
Notice that 30 years is still 1.67 times 18 years whether you compare years, weeks or days. That fixed ratio is the reason exact age counts as ratio data. For more on longer spans of time, see how long a decade is in years, weeks and days.
Recommended Tools for Analyzing Age Data
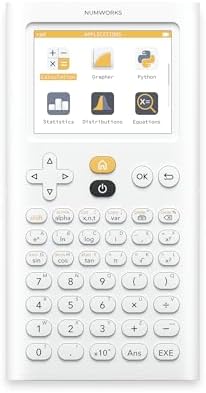
You can summarize ages with a spreadsheet, but a calculator with statistics functions helps in class and in exams. First, look for a list or table mode where you can type in raw ages. Next, check for one-variable statistics, which give the mean, median and standard deviation in one step. Also, a good review book is useful if you are preparing for a course test on scales of measurement.




As an Amazon Associate, Measuring Expert earns from qualifying purchases.
- Exact age in years, months or days is ratio data.
- Age ranges such as 18-24 and labels such as “senior” are ordinal data.
- Birth year is interval data, because the calendar zero is arbitrary.
- Stevens defined the four levels in a 1946 paper in Science.
- Higher levels allow more statistics: ratio data supports means, standard deviations and ratios.
- Grouping ages throws information away, so collect exact age and group it later if needed.
- Statistics software often lumps interval and ratio together as “scale” data.
Stevens’ Four Levels of Measurement, With Examples
Each level adds one property to the level before it. Nominal data only names things. Ordinal data adds order. Interval data adds equal spacing between values. Finally, ratio data adds a true zero, which makes statements such as “twice as much” meaningful.
| Level | What it tells you | Everyday examples | Age example |
|---|---|---|---|
| Nominal | Category names only, no order | Eye color, blood type, country of birth | Rare; an unordered group code |
| Ordinal | Order, but gaps of unknown size | Race finishing place, survey ratings, education level | Age groups: 18-24, 25-34, 35-44 |
| Interval | Equal gaps, no true zero | Temperature in °F or °C, calendar dates | Year of birth (1990, 2005) |
| Ratio | Equal gaps and a true zero | Height, weight, temperature in kelvins, income | Age in years, months or days |
For a broader look at how scales, units and standards fit together, our guide to the science of measurement covers the basics behind every measuring system.
Age Level of Measurement in Years: Ratio
Exact age passes every test for a ratio scale. First, the units are equal: the year from 9 to 10 is the same length as the year from 69 to 70. Second, zero means something real. At birth, a person has lived for zero time, so the scale starts at a natural point instead of an arbitrary one.

Because of that true zero, ratios work. A 40-year-old has lived twice as long as a 20-year-old, and a 6-month-old baby has lived half as long as a 1-year-old. Moreover, the ratio stays the same if you switch to months, weeks or days, as the converter above shows.
One common objection is that nobody has an age of exactly zero for long. That is true, but it does not matter. A ratio scale needs a meaningful zero point, not people who sit at zero. Similarly, nobody weighs zero pounds, yet weight is still ratio data.
When the Age Level of Measurement Becomes Ordinal
Things change once you bin ages into ranges. Suppose a survey asks respondents to tick one box: under 18, 18-24, 25-34, 35-44, 45-64 or 65 and over. You now know that someone in the 35-44 box is older than someone in the 18-24 box. However, you do not know by how much, and the boxes are not even the same width.
So grouped age is ordinal. The same applies to life-stage labels such as infant, child, teen, adult and senior, and to generation labels that follow birth order. Each label sits in a clear order, but the distance between neighbors is unknown.
| How you record age | Example values | Level |
|---|---|---|
| Exact age | 23, 25, 31, 38, 52 years | Ratio |
| Age in days for infants | 14, 90, 200 days | Ratio |
| Equal ranges | 20-29, 30-39, 40-49 | Ordinal |
| Unequal ranges | 18-24, 25-44, 65 and over | Ordinal |
| Life-stage labels | Child, adult, senior | Ordinal |
| Year of birth | 1971, 1988, 2001 | Interval |
Birth Year and Other Interval Cases
Here is the twist that many textbooks skip. Year of birth is a number, and the gaps between years are equal. Even so, the calendar zero is a convention, not a real starting point. As a result, you cannot say that someone born in 2000 is “1.0005 times” someone born in 1999. That makes birth year interval data, just like a temperature in degrees Fahrenheit.
Once you subtract birth year from the current year, though, you get time lived, and the result is ratio again. In other words, the scale depends on what the number measures, not on whether it looks like a number.
What Statistics Each Level Allows
Stevens tied each level to a set of “permissible” statistics. In practice, each level allows everything from the levels below it, plus a little more. Therefore, the age level of measurement you choose at the data collection stage limits your analysis later.

| Level | Center | Spread | Typical tests |
|---|---|---|---|
| Nominal | Mode | Counts, percentages | Chi-square test |
| Ordinal | Median, mode | Percentiles, interquartile range | Spearman rank correlation, Mann-Whitney U |
| Interval | Mean, median, mode | Range, standard deviation | Pearson correlation, t-test, ANOVA |
| Ratio | All of the above, plus geometric mean | All of the above, plus coefficient of variation | All of the above, plus ratio statements |
Here is a worked example. Take five exact ages: 23, 25, 31, 38 and 52. The mean is 33.8 years and the median is 31 years. The sample standard deviation is about 11.73 years, so the coefficient of variation is about 34.7%. You can only compute that last figure because age has a true zero.
Now group the same five people into 20-29, 30-39 and 50-59. You can still report the median group (30-39). However, any mean you compute from group midpoints is only an estimate, and it shifts if you pick different midpoints.
How to Find the Age Level of Measurement in Your Data
Use these steps whenever a dataset or homework question includes age.
- Write down how you recorded age. Look at the actual question or field: a date of birth, a number of years, a range or a label.
- Check whether the values are numbers with equal units. Years, months and days are equal units. Ranges and labels are not, so they stop at ordinal.
- Look for a true zero. Age counted from birth has one, so exact age is ratio. A calendar year such as 1990 has an arbitrary zero, so birth year is interval.
- Check the group widths if you used ranges. Unequal ranges such as 18-24 and 65 and over are clearly ordinal. Even equal ranges hide the exact ages inside them.
- Pick statistics that match the level. Use medians and percentiles for ordinal groups. Use means, standard deviations and ratios for exact ages.
- Report the level in your methods section. State how you measured age and which tests you ran, so readers can judge the results.
If your results look odd, also check the data for measurement bias. For instance, people sometimes round their age or report it to the nearest five years. Our explainer on what measurement bias is shows how errors like that creep in.
Do and Don’t When Working With Age Data
Do
- Collect date of birth or exact age whenever you can.
- State a reference date when you compute age.
- Use medians for grouped age data.
- Label each range clearly, with no overlaps.
- Keep birth year and age as separate variables.
Don’t
- Call age groups nominal; they have an order.
- Average group codes and call it a mean age.
- Compare birth years as ratios.
- Mix “age at last birthday” with rounded age.
- Throw away exact ages after you group them.
Honest Limits of the Four-Level Scheme
Stevens’ levels are a useful guide, not a law of nature. For one thing, many statisticians treat long ordinal scales, such as 7-point ratings, as roughly interval and run means on them. Meanwhile, others object to that practice. Both camps agree, however, that you should state what you did.
Age also has quirks of its own. Most records store age at last birthday, which drops the fraction of a year, so a person who is 29 years and 11 months counts as 29. In addition, pregnancy care counts gestational age from the first day of the last menstrual period, about two weeks before conception, so that zero differs from the birth zero. Finally, some cultures have counted age differently; for example, South Korea moved most legal and official uses to the international system in June 2023. None of this changes the level, but it does change the numbers you compare.
When to Ask a Statistician
For a class assignment, the rules on this page are usually enough. Still, some projects deserve expert help. These include clinical studies where age is a key risk factor, survey designs that will inform policy, and models where age interacts with other variables. In those cases, a statistician can advise on how to record age, whether to treat it as continuous, and which tests fit your design.
Frequently Asked Questions
What is the age level of measurement in statistics?
Age is a ratio variable when you record it as a number of years, months or days. It has equal units and a true zero at birth, so you can add, average and divide ages.
Is the age level of measurement interval or ratio?
Age in years is ratio, not interval. The zero point is real (the moment of birth), so a 40-year-old really has lived twice as long as a 20-year-old. Birth year, on the other hand, is interval data.
Can the age level of measurement be ordinal?
Yes. Once you sort people into ranges such as 18-24, 25-34 and 35-44, or into labels like child, adult and senior, you only know the order of the groups, so the data is ordinal.
Can age ever be nominal?
Rarely. Age groups keep their natural order, so they are ordinal. Only a label with no order at all, such as a group code used purely as a name, would be nominal.
Does the age level of measurement change with age groups?
It does. Exact age in years is ratio, but the same people grouped into ranges give ordinal data. The variable is the same; the way you recorded it sets the level.
Is age discrete or continuous?
Time since birth is continuous. In practice, though, most surveys record completed years, which turns age into whole numbers. Even so, it stays on a ratio scale.
Can I calculate the mean of age groups?
Only as an estimate. You can multiply each group midpoint by its count and divide by the total, but the result depends on the midpoints you choose. For an exact mean, collect age in years.
What statistics can I use for age in years?
Because age in years is ratio data, you can use the mean, median, mode, standard deviation, coefficient of variation, correlation, t-tests and regression.
Why does the age level of measurement matter?
It decides which summaries and tests are valid. For example, a mean of ordinal age codes such as 1, 2 and 3 can mislead, while a median of those codes still makes sense.
Who created the four levels of measurement?
Psychologist S. S. Stevens described nominal, ordinal, interval and ratio scales in a 1946 paper in the journal Science titled On the Theory of Scales of Measurement.
Age Level of Measurement: The Bottom Line
To sum up, exact age measured in years, months or days is ratio data, because it has equal units and a true zero at birth. Once you group it into ranges or life stages, it becomes ordinal, and birth year on its own is interval.
So collect exact age or date of birth whenever you can, because you can always group it later but never ungroup it. Then match your statistics to the level: medians for grouped ages, and means, standard deviations and ratios for exact ages.