

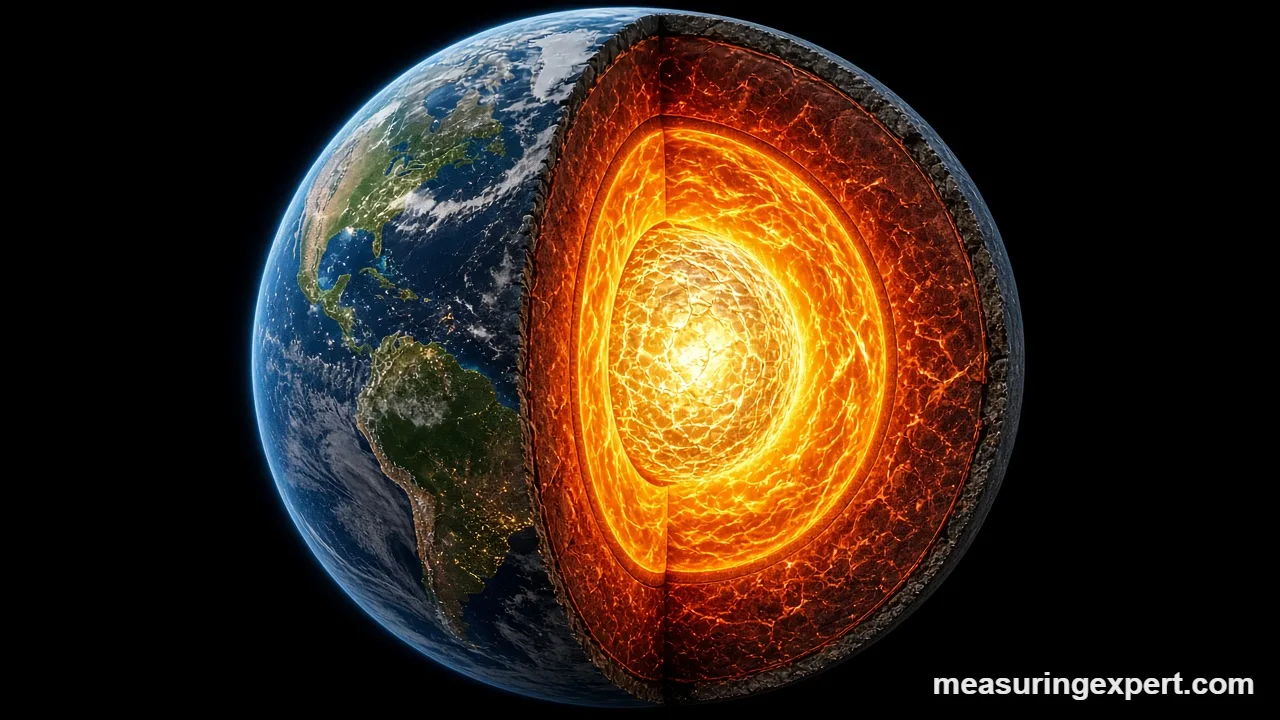
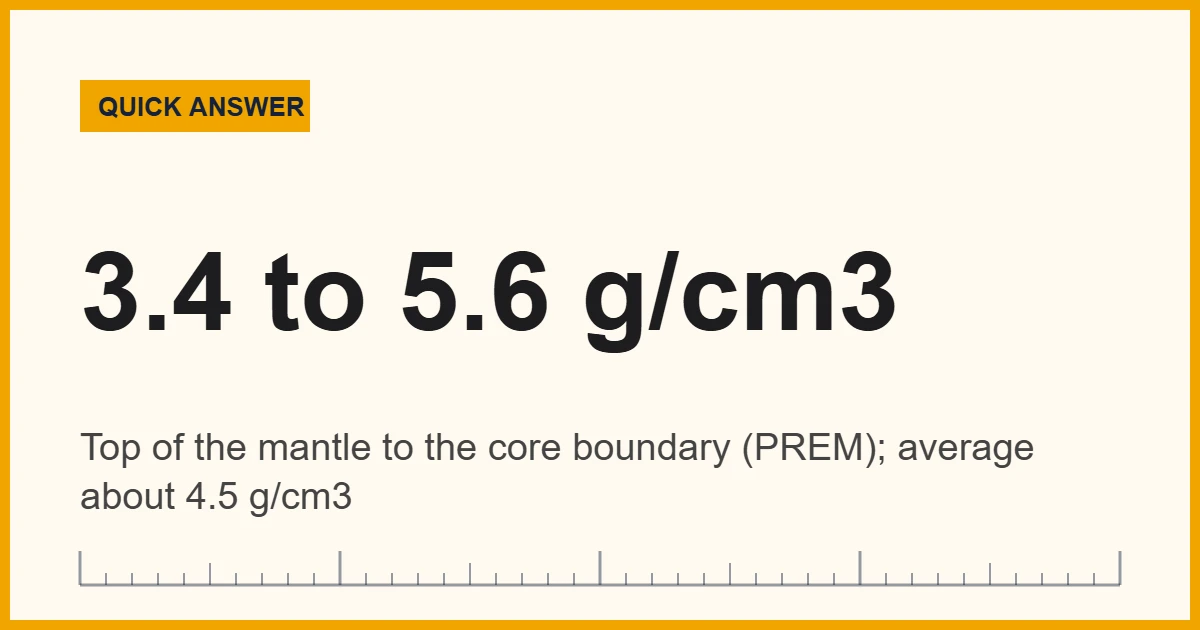
Earth’s mantle is about 3.4 g/cm3 (3,380 kg/m3, or 211 lb/ft3) just below the crust and grows denser with depth, reaching about 5.6 g/cm3 (5,570 kg/m3, or 348 lb/ft3) at the core boundary 2,891 km down. On average, the whole layer works out to roughly 4.5 g/cm3, according to the PREM reference model.
Convert Mantle Density to kg/m3 and lb/ft3
For example, geology papers usually give density in g/cm3, engineers often want kg/m3, and US readers may think in pounds per cubic foot. So type any value below, for example 4.5 for the average or 5.57 for the base, and the converter does the rest.
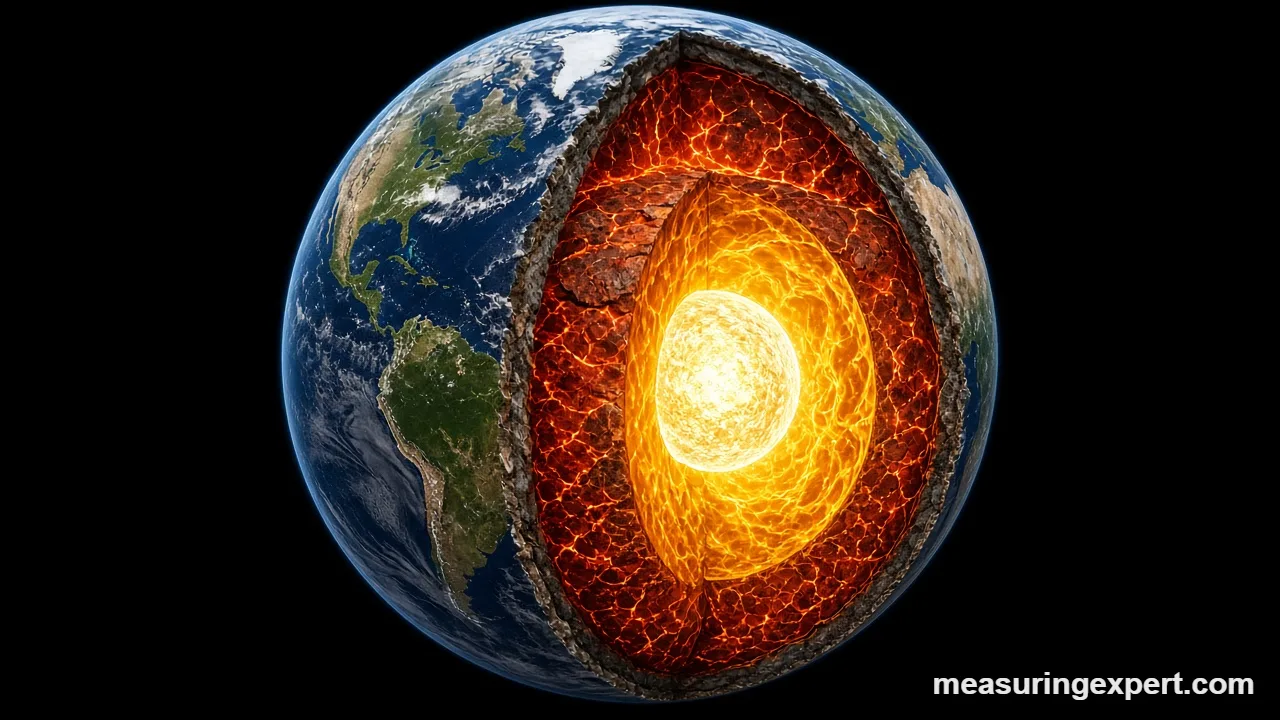
First, the mantle is the thick shell of hot, slowly creeping rock between the crust and the iron core. Also, it starts at the Moho, the base of the crust (about 7 km under the oceans and 25 to 70 km under continents), and ends 2,891 km below the surface. In fact, it fills about 83 to 84 percent of Earth’s volume and holds roughly two-thirds of its mass.
However, nobody has ever sampled the deep interior directly. Instead, the numbers on this page come from the Preliminary Reference Earth Model (PREM), which Adam Dziewonski and Don Anderson published in 1981. Specifically, it fits the travel times of earthquake waves, Earth’s vibration modes, its total mass and its moment of inertia. For reference, a course handout from the University of Hawaii lists the full PREM table of density and wave speeds, and that table is the source for the depth chart below.
In short, density climbs from top to bottom for two reasons. First, pressure squeezes the rock. Second, at certain depths the minerals switch to tighter crystal structures.
Mantle Density by Depth (PREM Chart)
The table below lists PREM values at the main boundaries and at several depths in between. Because some boundaries cause a jump, you will see two rows: one just above it and one just below. Also, the lb/ft3 column uses 1 g/cm3 = 62.428 lb/ft3.
| Depth (km) | Depth (miles) | Zone | Density (g/cm3) | Density (lb/ft3) |
|---|---|---|---|---|
| 24.4 | 15 | Just below the Moho | 3.38 | 211 |
| 220 (above) | 137 | Low-velocity zone | 3.36 | 210 |
| 220 (below) | 137 | Upper mantle | 3.44 | 215 |
| 400 (above) | 249 | Base of upper mantle | 3.54 | 221 |
| 400 (below) | 249 | Transition zone | 3.72 | 232 |
| 670 (above) | 416 | Base of transition zone | 3.99 | 249 |
| 670 (below) | 416 | Top of lower mantle | 4.38 | 273 |
| 1,000 | 621 | Lower mantle | 4.58 | 286 |
| 1,500 | 932 | Lower mantle | 4.86 | 303 |
| 2,000 | 1,243 | Lower mantle | 5.12 | 320 |
| 2,500 | 1,553 | Lower mantle | 5.37 | 335 |
| 2,891 | 1,796 | Base of mantle (core boundary) | 5.57 | 348 |
Printable tip: this chart prints cleanly on one page, so you can easily keep it with your notes. Note the small dip near 220 km, because PREM puts a slightly softer, less dense band there, and the biggest single jump comes at 670 km, where the density rises by almost 10 percent.
How Dense Is the Mantle Compared With the Crust and Core?
Next, the comparison below separates numbers that people often mix up, especially the average density of the whole planet and the density of any single layer.
| Layer or figure | Typical density (g/cm3) | kg/m3 | What it means |
|---|---|---|---|
| Water (for scale) | 1.00 | 1,000 | Reference point for “specific gravity” |
| Continental crust | about 2.7 | about 2,700 | Granite-like rock, light enough to stay on top |
| Oceanic crust | about 2.9 to 3.0 | 2,900 to 3,000 | Basalt and gabbro, a little heavier |
| Mantle (top to base) | 3.38 to 5.57 | 3,380 to 5,570 | Rises with pressure and mineral changes |
| Mantle (average) | about 4.5 | about 4,500 | Total mass divided by total volume of the layer |
| Whole Earth (average) | 5.51 | 5,513 | Planet mass divided by planet volume |
| Outer core (top) | 9.90 | 9,900 | Liquid iron alloy |
| Earth’s center | 13.09 | 13,090 | Solid iron-nickel inner core |
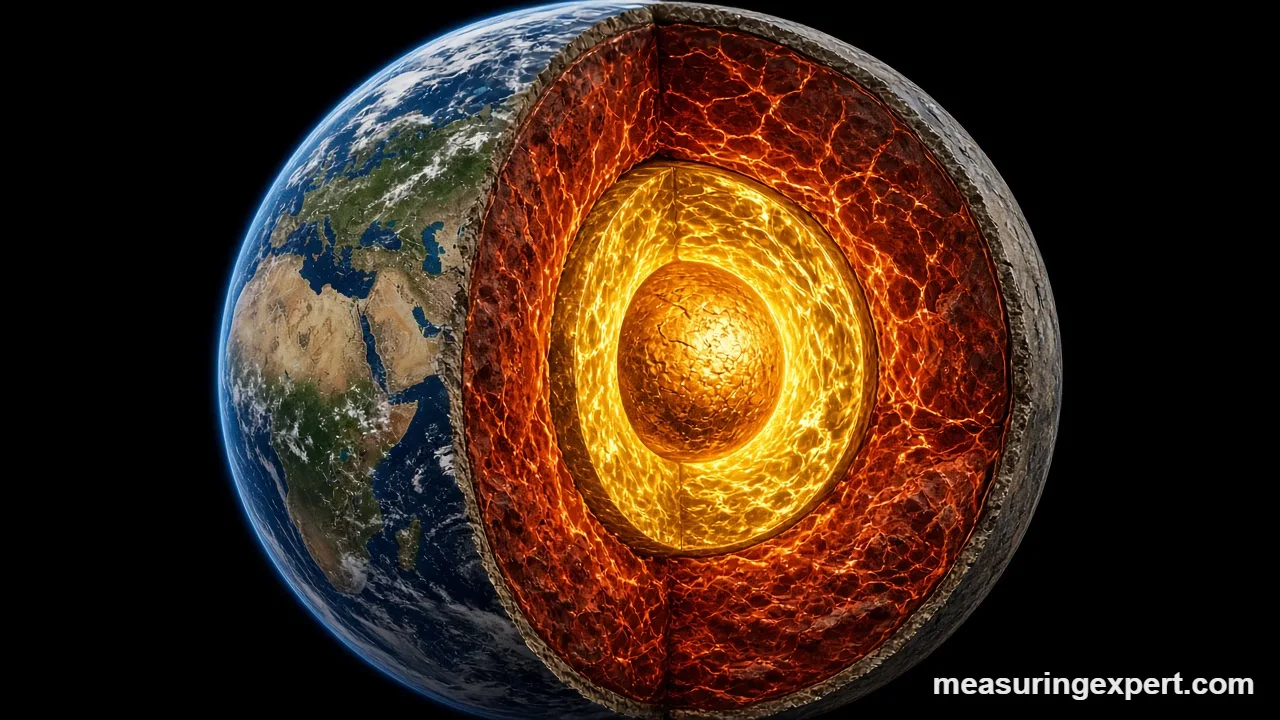
The whole-Earth figure comes from the NASA Earth fact sheet, which lists a mean density of 5,513 kg/m3. Surprisingly, that average is higher than any part of the mantle. That is because of the core: it takes up only about 16 percent of the volume, yet it is roughly twice as dense as the rock above it. Surface rocks, by contrast, average only around 2.7 g/cm3. As a result, early scientists realized long before seismology that the deep Earth had to hide something heavy. For more on that whole-planet number, see our guide on how dense Earth is.
What the Mantle Is Made Of, and Why It Gets Denser
To begin with, the upper part of this layer is mostly peridotite, a rock rich in olivine, with pyroxene and garnet. These are magnesium-iron silicates, and therefore they are heavier than the feldspar and quartz that dominate continental crust. Similarly, the iron content matters: more iron in a mineral means a higher density.
Pressure does the rest. In particular, at depth the weight of the rock above forces atoms into more compact arrangements. For example, near 410 km olivine changes to a denser form called wadsleyite, and further down it becomes ringwoodite. Then, near 660 km, ringwoodite breaks down into bridgmanite and ferropericlase. Together, these two minerals make up most of the lower mantle, and each switch shows up as a jump in the density chart.
By mass, a common estimate of the bulk composition (pyrolite) is roughly 44 percent oxygen, 23 percent magnesium, 21 percent silicon and 6 percent iron, plus smaller amounts of calcium and aluminum. In other words, it is mainly magnesium silicate rock with a modest share of iron.
How Scientists Work Out the Density of the Mantle
Density, however, is not something you can read off a seismogram directly. Instead, wave speeds depend on density and stiffness together, so researchers solve for all three at once. Here is the general workflow, step by step:
- Record earthquake waves worldwide. First, seismometers time the arrival of P waves (compressional) and S waves (shear) at thousands of stations.
- Turn travel times into speed profiles. By comparing arrivals at different distances, researchers calculate how fast P and S waves move at each depth.
- Link speed to stiffness and density. The P-wave speed equals the square root of (K + 4/3 mu) divided by density, and the S-wave speed equals the square root of mu divided by density, where K is bulk modulus and mu is shear modulus.
- Apply self-compression. The Adams-Williamson equation predicts how fast density must rise with depth for rock squeezed by its own weight, using the two wave speeds.
- Check against the whole planet. Any density profile must add up to Earth’s known mass and moment of inertia, and it must also match the planet’s natural vibrations after large earthquakes.
- Compare with lab data. Diamond-anvil cells and shock experiments squeeze and heat candidate minerals, so their measured densities test the model.
For example, just below 670 km PREM gives a P-wave speed of 10.75 km/s and an S-wave speed of 5.95 km/s, together with a density of 4.38 g/cm3. Moreover, those three values fit each other and the layers around them, which is why researchers trust the profile within a few percent.
Do and Don’t When Reading Mantle Density Figures
Do
- Check which model a number comes from (PREM, AK135, or a regional study).
- Note the depth, because “3.3” and “5.6” describe different places.
- Keep units straight; after all, 1 g/cm3 equals 1,000 kg/m3.
- Separate the layer average from the whole-Earth average, too.
- Round sensibly; for example, two decimals is usually plenty.
Don’t
- Quote 5.51 g/cm3 as the density of the mantle.
- Expect one value to fit every region, since local rock varies.
- Mix the 410/660 km and 400/670 km boundary labels, because readers get confused.
- Read density straight from wave speeds alone, because stiffness matters too.
- Assume the layer is liquid; it is solid rock that flows very slowly.
Honest Limits of Mantle Density Numbers
To be clear, PREM is a one-dimensional average: it gives one value per depth for the whole planet. Real Earth, however, is lumpier. For instance, cold slabs of old ocean floor sink into the deep interior, and hot plumes rise from it. As a result, each changes the local density by a fraction of a percent to around a percent. In addition, two huge zones above the core, under Africa and the Pacific, also slow seismic waves, and their exact density is still debated.
Moreover, seismic waves pin down stiffness-to-density ratios better than density alone. Consequently, the density curve carries more uncertainty than the wave-speed curves, perhaps a few percent in parts of the lower mantle. Finally, the mantle average of about 4.5 g/cm3 also depends on where you draw the top boundary, since crust thickness varies from about 7 km to 70 km.
When Accuracy Really Matters
For school work and general reading, therefore, “about 3.3 to 5.6 g/cm3, average about 4.5” is a solid answer. Still, a few situations call for more care:
- Research and modeling. Always cite the exact model and version, because newer regional models can differ from PREM.
- Exam answers. Similarly, use whatever values your textbook or teacher gives, since grading usually follows the course material.
- Unit conversions. A slip between g/cm3 and kg/m3 is a factor of 1,000, so use the converter above to double-check. For a simple reference point, see how dense water is.
Mantle Density FAQs
How dense is the mantle on average?
The whole layer averages about 4.5 g/cm3, or about 4,500 kg/m3. By comparison, near the top it is about 3.4 g/cm3, and at the base it reaches about 5.6 g/cm3.
Is the mantle denser than the crust?
Yes. For example, continental crust averages about 2.7 g/cm3 and oceanic crust about 3.0 g/cm3, while the uppermost mantle starts near 3.4 g/cm3.
Why is the core denser than the mantle?
The core is mostly iron and nickel, which are much heavier than the magnesium silicate rock above. As a result, its density jumps from 5.57 to about 9.9 g/cm3 at the boundary.
What is mantle density in kg/m3?
In short, it runs from about 3,380 kg/m3 below the crust to about 5,570 kg/m3 at the core boundary. In other words, multiply g/cm3 by 1,000 to get kg/m3.
How many pounds per cubic foot is that?
It ranges from about 211 lb/ft3 at the top to about 348 lb/ft3 at the base, with an average near 281 lb/ft3.
Does density increase steadily with depth?
Mostly, but not smoothly. It climbs gradually under pressure and then jumps at about 410 km and 660 km, where minerals change structure.
Is the mantle liquid?
No. Instead, it is solid rock, but over millions of years it creeps slowly, which drives plate tectonics. Only small pockets melt, mainly near the top.
How thick is the mantle?
It is about 2,820 to 2,885 km thick, depending on crust thickness. The base sits 2,891 km (about 1,796 miles) below the surface.
Why is Earth’s average density higher than the mantle?
The heavy core pulls the average up, because it is so dense. Earth as a whole averages 5.51 g/cm3, which is close to the very base of the mantle and well above its 4.5 g/cm3 average.
Who first worked out these density values?
No one measured them directly. Instead, the standard values come from PREM, a model built by Adam Dziewonski and Don Anderson in 1981 from seismic data, Earth’s mass and its moment of inertia.
The Bottom Line
To sum up, the mantle starts at about 3.4 g/cm3 under the crust and reaches about 5.6 g/cm3 just above the core, with an overall average near 4.5 g/cm3. Meanwhile, pressure squeezes the rock, and mineral changes at about 410 and 660 km add sudden steps. Therefore, always say which depth you mean when you quote one number.
Finally, if you need those values in kg/m3 or lb/ft3, use the converter at the top of the page.
Add ad-free music to your kitchen or workshop
1 thought on “How Dense Is the Mantle? Density by Depth, From 3.4 to 5.6 g/cm3”