

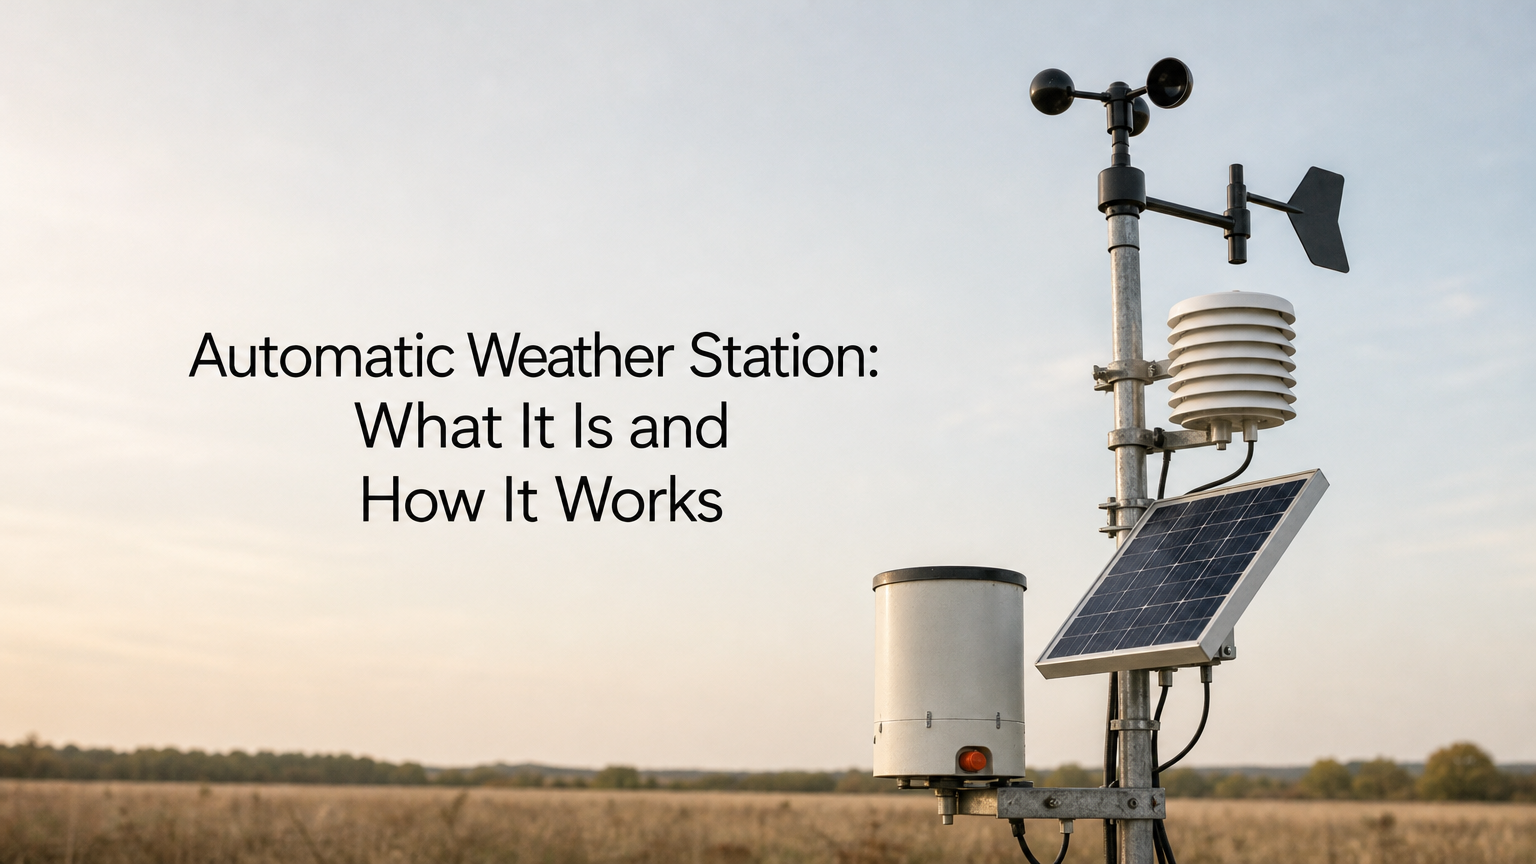
An automatic weather station (AWS) is a self-running set of weather sensors, a data logger, a power source, and a communication link. It measures conditions such as temperature, wind, rain, humidity, and pressure, and it records or transmits them without a person taking readings. You will also see it called an automated weather station. It can be a single unit in a field or one node in a network of hundreds.
Nothing about it is mysterious. Each sensor turns a physical quantity into an electrical signal. The logger samples and stores that signal, and a Wi-Fi, cellular, radio, or satellite link sends it to whoever needs it. This article covers why these stations matter, how they work step by step, which sensors they carry, where they are used, the main types and what they cost, and how to choose and place one correctly.
At Measuring Expert we write about measuring tools and accuracy, and a weather station is a bundle of measuring instruments that must stay accurate while nobody is watching. That is why placement, calibration, and sensor quality run through everything below. Treat this guide as education, not as professional advice for safety-critical decisions.
Why an automatic weather station matters
An automatic weather station matters because weather changes faster, and in more places, than people can measure by hand. It gives you a continuous, consistent record from locations where no observer could stand all day. That record feeds forecasts, climate studies, flight operations, farm decisions, and the weather display in your own backyard.
What automation gives you
A human observer reads instruments at fixed times, often once or twice a day. A front that passes at 2 a.m. or a gust that lasts 20 minutes simply never makes it into the log. A station that records every minute or every few minutes catches both. It also removes reading errors and differences between observers, because the same sensor measures the same way every time.
The second gain is reach. Automatic stations run on small solar panels and batteries, so you can place them on mountain ridges, in deserts, on ocean platforms, and in burn-prone forests. Wikipedia’s definition of the AWS puts it plainly: it either saves human labor or enables measurements from remote places. In practice, the stations are the backbone of modern surface observation networks.
A person with a thermometer samples the weather a few times a day, and an automatic station samples it all day and night.
Who relies on the data
The people who depend on station data are more varied than most readers expect:
- Forecasters and climate researchers feed observations into models and long-term records.
- Pilots and airport operators use wind, visibility, and pressure for takeoffs and landings.
- Farmers and growers time irrigation, frost protection, and spraying from local readings.
- Wildfire managers watch wind, humidity, and fuel dryness to judge fire danger.
- Schools use stations to teach the scientific method with live data.
- Home owners use them to plan gardens, check conditions at home, and satisfy curiosity.
The common thread is that a nearby, trustworthy measurement beats a regional forecast when conditions vary from one valley, field, or runway to the next.
Where automation falls short
An AWS is not perfect. Sensors drift over time, and a badly sited station produces confident but wrong numbers. A station also measures only the spot where it stands. If it records no wind gust, that tells you only that no gust occurred at that exact location. A storm may have produced a damaging gust a few hundred yards away.
Some observations are still harder to automate than others. Judging cloud types, spotting hail, or describing what the sky actually looks like usually needs optional sensors or a human eye. Good practice is to treat station data as a very reliable point measurement and to cross-check it against nearby stations when something looks odd.
How an automatic weather station works
An automatic weather station works in five steps: sensors measure, a logger samples and stores, software processes the numbers, a link transmits them, and a server or display shows the result. Every station, from a $150 backyard unit to a national network station, follows this same chain.
The five-step data path
Here is the path a reading takes from the air to your screen:
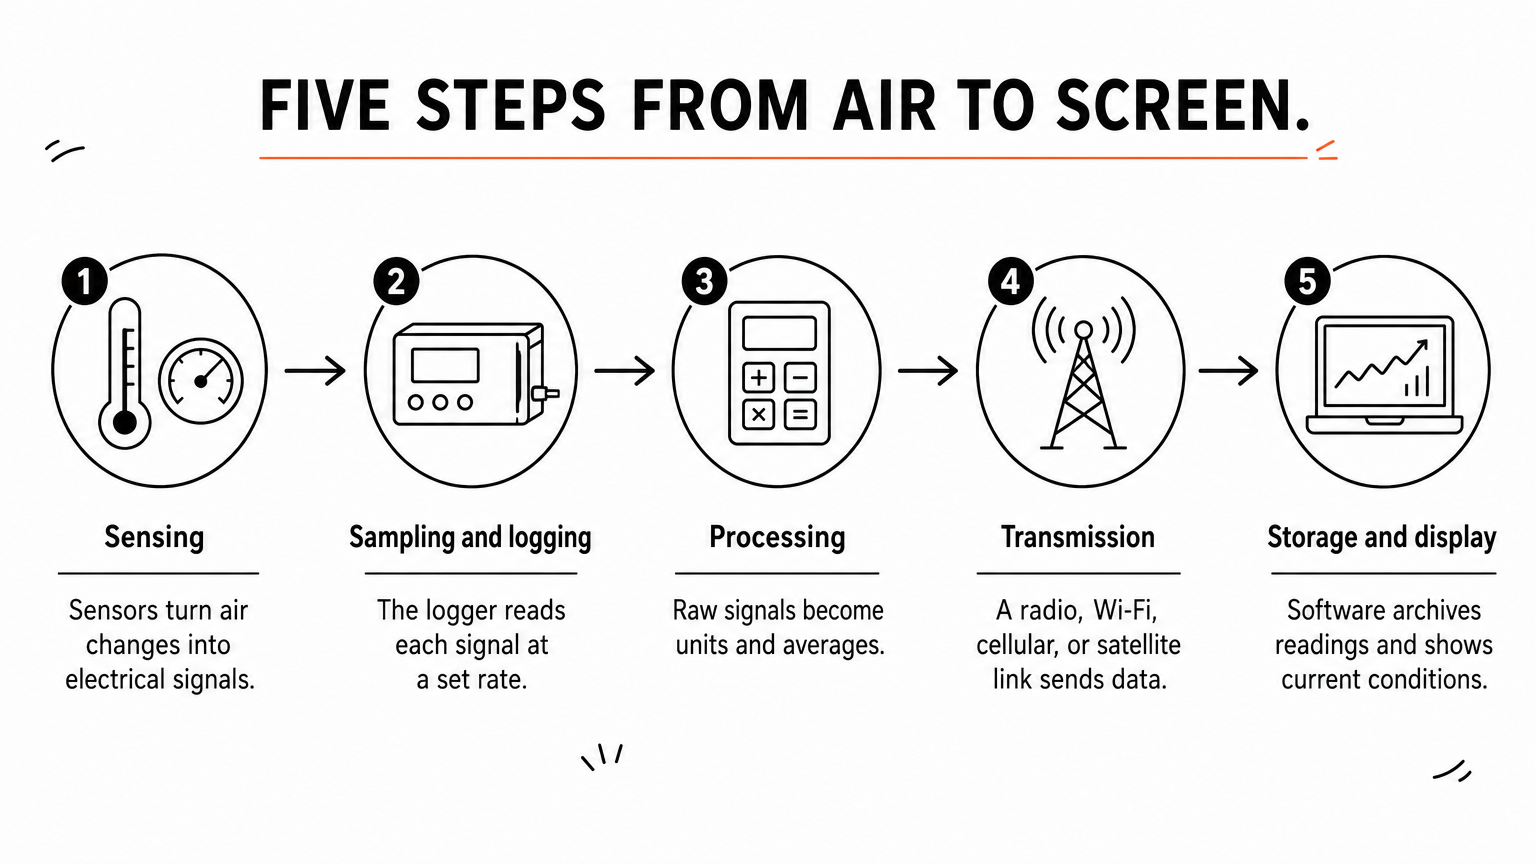
- Sensing. Each sensor converts a physical change into an electrical signal. A temperature sensor changes its resistance, a rain gauge closes a tiny switch, and a wind sensor, or anemometer, produces pulses or timed ultrasonic signals.
- Sampling and logging. The data logger, or the console in a home station, reads each signal at a set rate. Wind may be sampled every few seconds, while temperature may be sampled every few seconds or once a minute.
- Processing. The logger converts raw signals into units such as °F, mph, or inches, then averages them. It also calculates derived values such as dew point and wind chill.
- Transmission. A radio, Wi-Fi, cellular, or satellite link sends the processed data onward at set intervals.
- Storage and display. A computer, server, or app archives the data and shows it as current conditions, graphs, or alerts.
The logger is the brain of the system. If it fails or loses power, the best sensors in the world produce nothing, so a battery backup for the logger is one of the first things professionals specify.
Power and communication choices
Most remote stations run on a small solar panel charging a battery, which is why they can sit far from the grid. Home stations usually use batteries in the outdoor sensor unit, often with a solar assist, and wall power for the indoor console. The United States wildfire network of Remote Automatic Weather Stations (RAWS) is a good example: the units are solar powered and measure wind speed and direction, air temperature, precipitation, relative humidity, solar radiation, and fuel moisture.
How the data leaves the station depends on where the station sits:
| Link | Best for | Main trade-off |
|---|---|---|
| Wi-Fi | Home and school stations near a router | Range limited to your network |
| Short-range radio | Farms and campuses with a base station | Needs a nearby receiver |
| Cellular modem | Most commercial and research stations | Needs coverage and a data plan |
| Satellite | Wilderness, ocean, and polar sites | Higher hardware and service cost |
A worked example of sampling and averaging
Suppose a station has six sensors and logs a reading every 5 minutes. That is 288 readings per sensor per day (24 hours times 12 readings per hour). Across six sensors, that is 1,728 readings per day, or 630,720 readings per year. No human observer could match that volume or consistency.
Wind shows why averaging matters. A gust lasts seconds, so the logger samples wind often and reports both an average over a set period, commonly 10 minutes in international practice, and the peak gust within it. Without that step, you would see either a jittery mess of numbers or a smooth average that hides the gust.
Every automatic weather station follows the same chain: sense, sample, process, transmit, display.
Sensors and measurements an automatic weather station includes
A typical automatic weather station measures air temperature, humidity, pressure, wind speed, wind direction, rainfall, and often solar radiation. Professional stations add sensors for lightning, visibility, soil, snow, and cloud height. The table below shows the core set and where each sensor normally goes.
The core sensors
| Measurement | Typical sensor | How it works | Usual placement |
|---|---|---|---|
| Air temperature | Thermistor or platinum resistance thermometer | Electrical resistance changes with temperature | Inside a radiation shield, about 4 to 6 ft (1.25 to 2 m) above ground |
| Relative humidity | Capacitive polymer sensor | Capacitance changes as the polymer absorbs water vapor | Same shield as temperature |
| Air pressure | Silicon barometer | A tiny diaphragm flexes with pressure | Often inside the logger enclosure |
| Wind speed | Cup, propeller, or ultrasonic anemometer | Spin rate or sound travel time | Standard height is 33 ft (10 m) in open terrain |
| Wind direction | Wind vane or ultrasonic sensor | Vane angle or sound travel time | Same mast as wind speed |
| Rainfall | Tipping-bucket rain gauge | Each bucket tip equals a fixed depth | Level, in the open, away from trees |
| Solar radiation | Pyranometer | Measures sunlight energy reaching a flat surface | Level and unshaded |
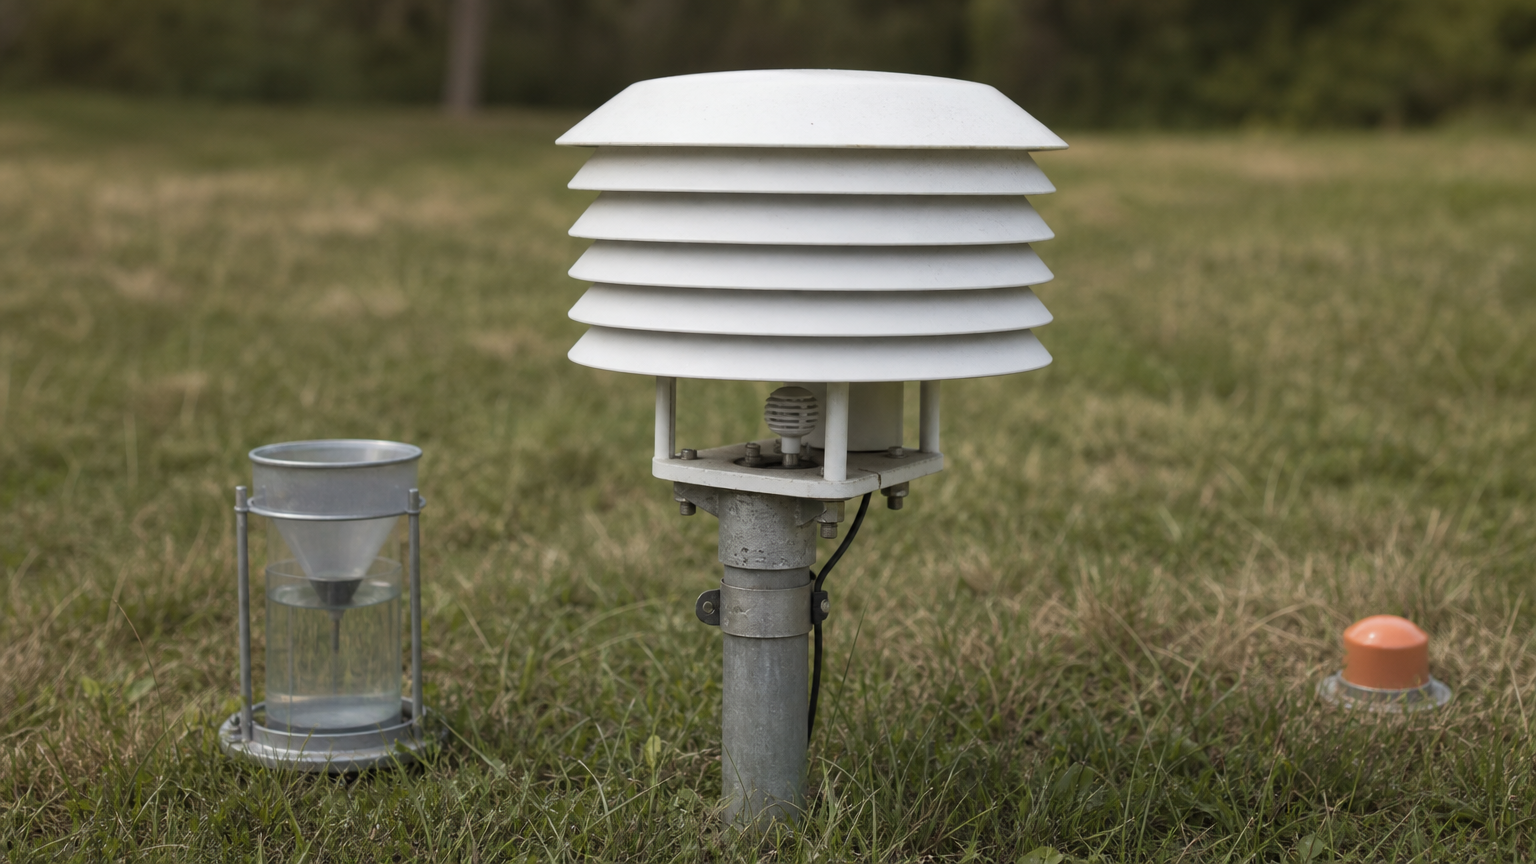
Temperature and humidity sensors must sit inside a radiation shield, a ventilated white housing that blocks direct sun and rain while letting air through. Without it, sunlight heats the sensor and the reading can run several degrees too high on a bright day. Many cheap home stations skimp on this part, and it is the most common reason a backyard station disagrees with the official one down the road.
Optional and derived measurements
Beyond the core set, stations can add sensors for the job at hand. A lightning sensor helps schools, golf courses, and event venues spot dangerous storms. Visibility sensors and cloud-height instruments serve airports. Farm stations add soil moisture sensors, soil temperature, and leaf wetness. Snow stations add depth sensors and weighing gauges. Fire-weather stations add fuel moisture, which estimates how dry dead vegetation is.
Stations also calculate values rather than measuring them. Dew point comes from temperature and humidity. Heat index combines temperature and humidity. Wind chill combines temperature and wind. Farm stations may calculate evapotranspiration, the water lost from soil and plants, from temperature, humidity, wind, and solar radiation. If a spec sheet lists twenty readings, many of them are calculations from five or six sensors.
Rain gauge math and realistic accuracy
A tipping-bucket rain gauge counts tips. Many US home stations use 0.01 inch per tip, so 37 tips equals 0.37 inch, or about 9.4 mm, of rain. Professional gauges often use 0.2 mm per tip, which gives finer resolution. Heavy downpours can make the bucket undercount, and snow or ice can block the funnel, so gauges without heaters under-report in winter.
On accuracy, consumer stations often quote about 1 to 2 °F for temperature and 3 to 5 percent for relative humidity. Research-grade sensors can be several times tighter, with temperature accuracy of a few tenths of a degree Celsius. Treat those as typical ranges, not promises. Placement and upkeep affect your readings more than a small difference in sensor specs.
Six or seven well-sited sensors do the real work, and the rest of the readings on a spec sheet are calculated from them.
Where automatic weather stations are used
Automatic weather stations are used wherever someone needs frequent, trustworthy local weather data: national observing networks, airports, wildfire zones, farms, research sites, offshore platforms, schools, and homes. The common factor is a need for readings around the clock without a person on site.
National networks, airports, and wildfire zones
National weather services run thousands of automated stations to build their surface observation networks. In the United States, the Automated Surface Observing System (ASOS) and the Automated Weather Observing System (AWOS) serve many airports, giving pilots current wind, visibility, temperature, pressure, and cloud information. Airports depend on hyperlocal readings because conditions on the runway can differ from those a few miles away.
Wildfire agencies rely on the RAWS network. Because the units are solar powered and sit in remote terrain, they can report wind, humidity, temperature, rainfall, and fuel moisture for fire danger ratings where no power line exists. Offshore stations on platforms and buoys do a similar job at sea, monitoring wind, temperature, humidity, and pressure for shipping and marine forecasts.
Farms, research, education, and industry
On farms, stations guide irrigation, frost protection, and spray timing. A grower who sees humidity and wind at the field itself can avoid spraying on a windy afternoon or irrigating right before rain. Research teams use stations to study climate, hydrology, and ecology, and meteorologists use station data to check radar and satellite estimates against ground truth.
Other users include:
- Schools, which use stations for STEM lessons and for lightning safety on athletic fields.
- Construction and utilities, which watch wind and lightning for crane and crew safety.
- Solar and wind developers, which measure sunlight and wind before they build.
- Event venues and golf courses, which use real-time alerts to clear people from open areas.
At home
Home stations, often called personal weather stations, sit on a pole, fence, or roof and send readings to an indoor console or phone app. People use them for gardening, planning outdoor work, and checking frost or heat risk. Many owners also share data with public weather networks, which turns a single backyard unit into one small piece of a much denser map.
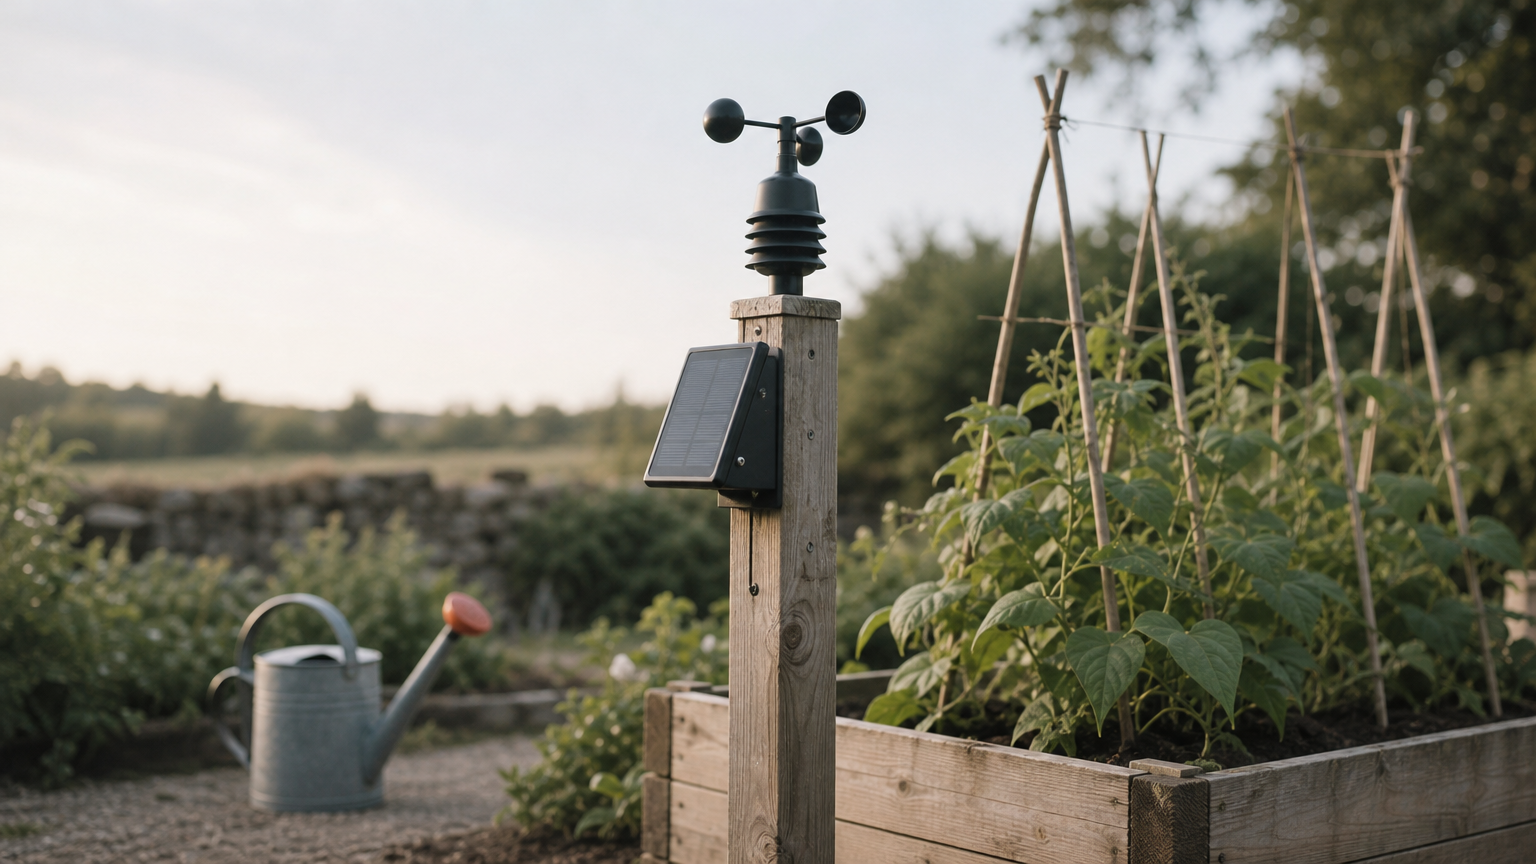
Is a home station worth it? It is if you care about hyperlocal readings such as frost on your garden or wind on your lot, and if you will place it properly. If you just want to know whether to carry an umbrella, a free forecast app is cheaper and often enough.
The more a decision depends on conditions at one exact spot, the more an automatic weather station pays for itself.
Types of automatic weather stations and what they cost
Automatic weather stations fall into four broad types: personal stations, agricultural and environmental stations, professional or national network stations, and specialized remote units such as offshore and wildfire stations. Prices run from roughly the cost of a nice dinner to the cost of a car or more.
Four types compared
| Type | Typical use | Power and link | Rough price |
|---|---|---|---|
| Personal station | Home, garden, school | Battery or solar plus Wi-Fi | About $100 to $600 |
| Agricultural or environmental station | Farms, orchards, research plots | Solar plus cellular or radio | Roughly $1,000 to several thousand |
| Professional or network station | Airports, utilities, weather services | Solar or mains plus cellular, fiber, or satellite | Several thousand to tens of thousands |
| Specialized remote station | Wildfire zones, offshore, polar | Solar plus satellite | Custom, usually high |
Those prices are rough ranges that vary with brand, sensor count, and installation. Treat the figures as planning numbers and check current listings before you budget. Installation, mounting hardware, and communication plans can add real cost beyond the station itself.
What you pay for as you move up
The jump in price buys three things. The first is sensor quality and calibration traceability, meaning the sensors hold their accuracy longer and can be checked against a reference. The second is durability, with sealed enclosures, surge protection, and parts rated for extreme temperatures. The third is communication and power, such as satellite links and backup batteries that keep data flowing for days without sun.
Personal stations trade some of that for convenience. They are plug-and-play, arrive as one package, and are good enough for garden and home use. Professional stations are modular. You choose each sensor, the logger, the mast, and the power system, which gives you flexibility and precision but demands more know-how.
Single stations and networks
A station can stand alone or work as part of a network. A single station tells you about one location. A network adds redundancy and context: if one station goes offline, nearby ones fill the gap, and forecasters can map patterns across a region. Most home users can join a public network by uploading their data, which costs nothing beyond the station itself.
If you are shopping, decide first whether you need a self-contained package or a modular system. Then match the type to your goal. A gardener does not need airport-grade sensors, and a utility monitoring wind for a crane does not want a hobby console.
Choose the station type from the decision you need to make, not from the longest spec sheet.
How to choose, place, and maintain an automatic weather station
Choose a station by starting with your purpose, then pick sensors, power, and communication to fit, and finally plan where it will stand and how you will maintain it. A mid-range station placed correctly will beat an expensive one placed badly.
Match the station to the job
Work through these questions before you buy:
- What decision will the data support? Frost alerts need good temperature and humidity. Irrigation needs rain and evapotranspiration. Lightning safety needs a lightning sensor.
- Which sensors do you need today, and which later? Modular systems let you add soil or snow sensors; all-in-one packages usually do not.
- How will it be powered? Solar plus battery suits remote spots, while mains power suits a roof next to an outlet.
- How will the data reach you? Wi-Fi works at home, and cellular or satellite works elsewhere.
- Can you export the data? If you want long-term records, make sure you can download or share readings in standard formats.
Check these points in the product listing before you buy, and if a detail is missing, ask the maker. Good stations also publish their sensor accuracy and the recommended mounting heights.
Place it where the readings will be true
Siting is where most home stations go wrong. Use these rules of thumb, which follow standard meteorological practice:
- Temperature and humidity: mount the shielded sensor about 4 to 6 ft (1.25 to 2 m) above short grass, away from pavement, walls, dryer vents, and air conditioners.
- Wind: the standard height is 33 ft (10 m) in open terrain, with clear space around the mast of roughly ten times the height of nearby obstacles. If you must mount on a roof, put the sensor well above the roofline and accept that readings will run lower and gustier than official values.
- Rain: set the gauge level in the open, with a distance from trees and buildings of at least two to four times their height.
- Solar radiation: mount the sensor level and keep it out of shade all day.
A pole at the corner of a lawn will usually outperform a bracket on the side of a house. If you cannot meet every rule, meet the ones that matter most for your use, and note the limits when you read the data.
Maintain and check it
Unattended does not mean maintenance-free. Plan on a simple routine:
| Task | How often |
|---|---|
| Clean the rain gauge funnel and check it is level | Monthly, and after storms |
| Clear insects, webs, and debris from the radiation shield | Monthly in warm seasons |
| Check wind sensor for free spinning and a tight mast | Every few months |
| Replace batteries or check solar charging | Yearly |
| Compare readings with a nearby official station | Every season |
| Recalibrate or replace humidity sensors | Commonly every 1 to 2 years |
Humidity sensors drift the most, so they are the first to check when a reading looks off. A good test is to compare your station with the nearest official one on a calm, clear day. A steady gap in temperature or humidity usually means placement or drift, not a real difference in weather. A short seasonal comparison catches problems before they quietly corrupt months of data.
A station that is placed correctly and cleaned regularly will beat a pricier one that is neglected.
Putting it all together
An automatic weather station is a group of sensors, a logger, power, and a data link that measures weather around the clock without a person on site. Seven core measurements do most of the work: temperature, humidity, pressure, wind speed, wind direction, rainfall, and sunlight. Everything else is an option or a calculation.
What separates good data from bad is rarely the price tag. It is the shield around the temperature sensor, the height of the wind mast, the level of the rain gauge, and the routine that keeps them clean and checked. Match the station type to the decision you need to make, site it by the rules above, and compare it against a nearby official station each season.
If you want more help choosing and testing tools that give you numbers you can trust, see our home weather stations compared and the other measuring guides at Measuring Expert.